Fig. 3
Download original image
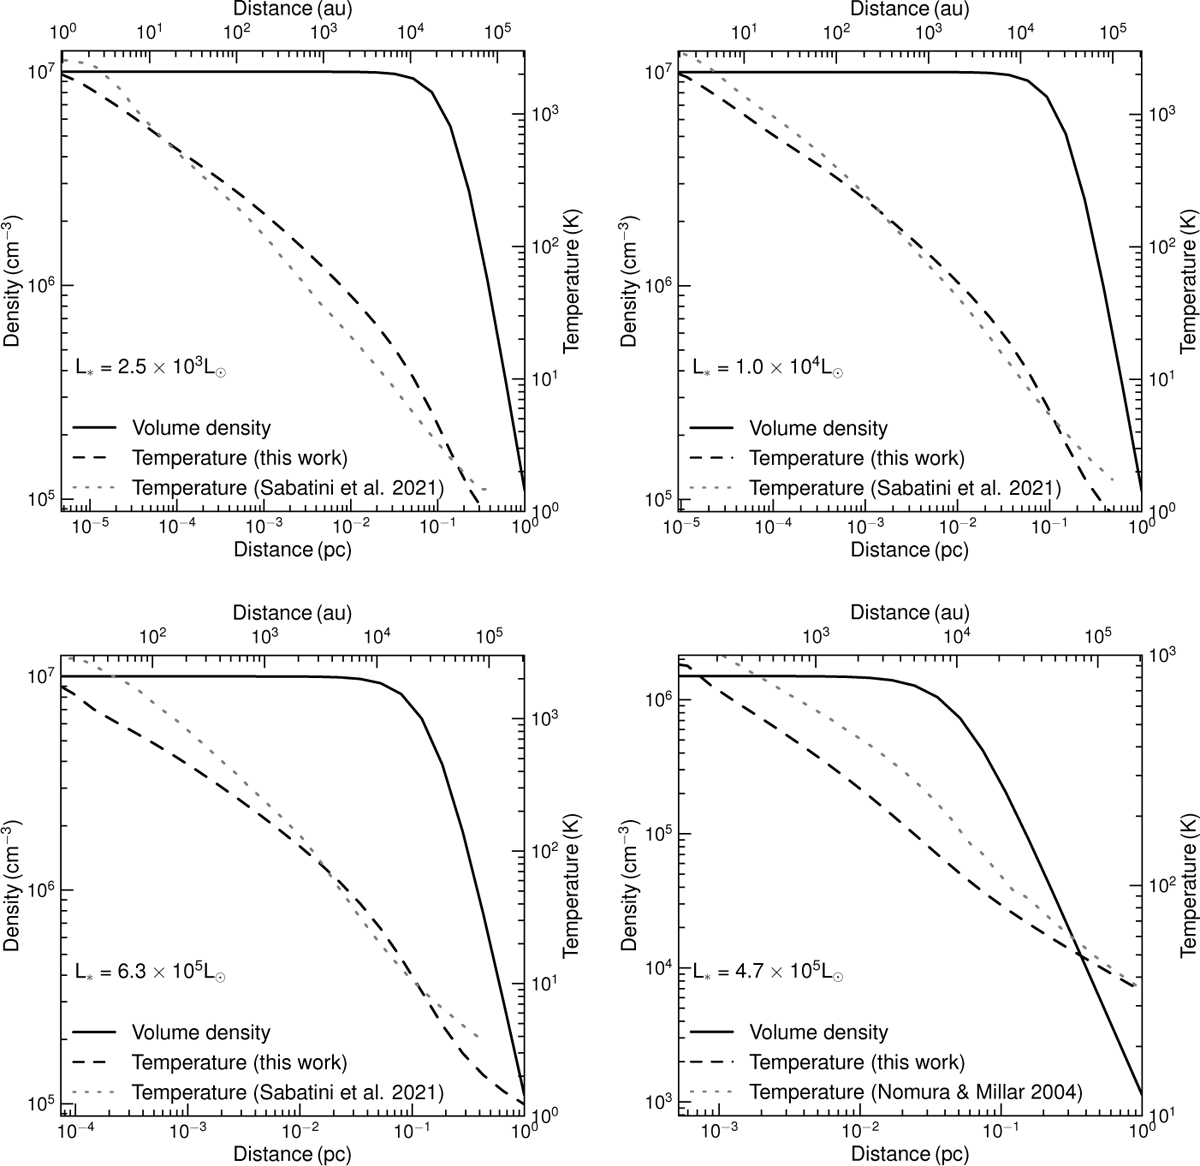
Examples of radial profiles of the gas density (solid line, left y-axis) and dust temperature (dashed line, right y-axis) in protostars of different L* embedded in a molecular core for r ≥ rthreshold. In each panel, our temperature profile is compared to the profiles found in the literature. For the profiles from Sabatini et al. (2021), we used n0 = 107 cm−3 and r0 = 0.15 pc, the same as the authors. For the profile from Nomura & Millar (2004), we used n0 = 1.5 × 106 cm−3 and r0 = 0.05 pc.
Current usage metrics show cumulative count of Article Views (full-text article views including HTML views, PDF and ePub downloads, according to the available data) and Abstracts Views on Vision4Press platform.
Data correspond to usage on the plateform after 2015. The current usage metrics is available 48-96 hours after online publication and is updated daily on week days.
Initial download of the metrics may take a while.