Fig. 4
Download original image
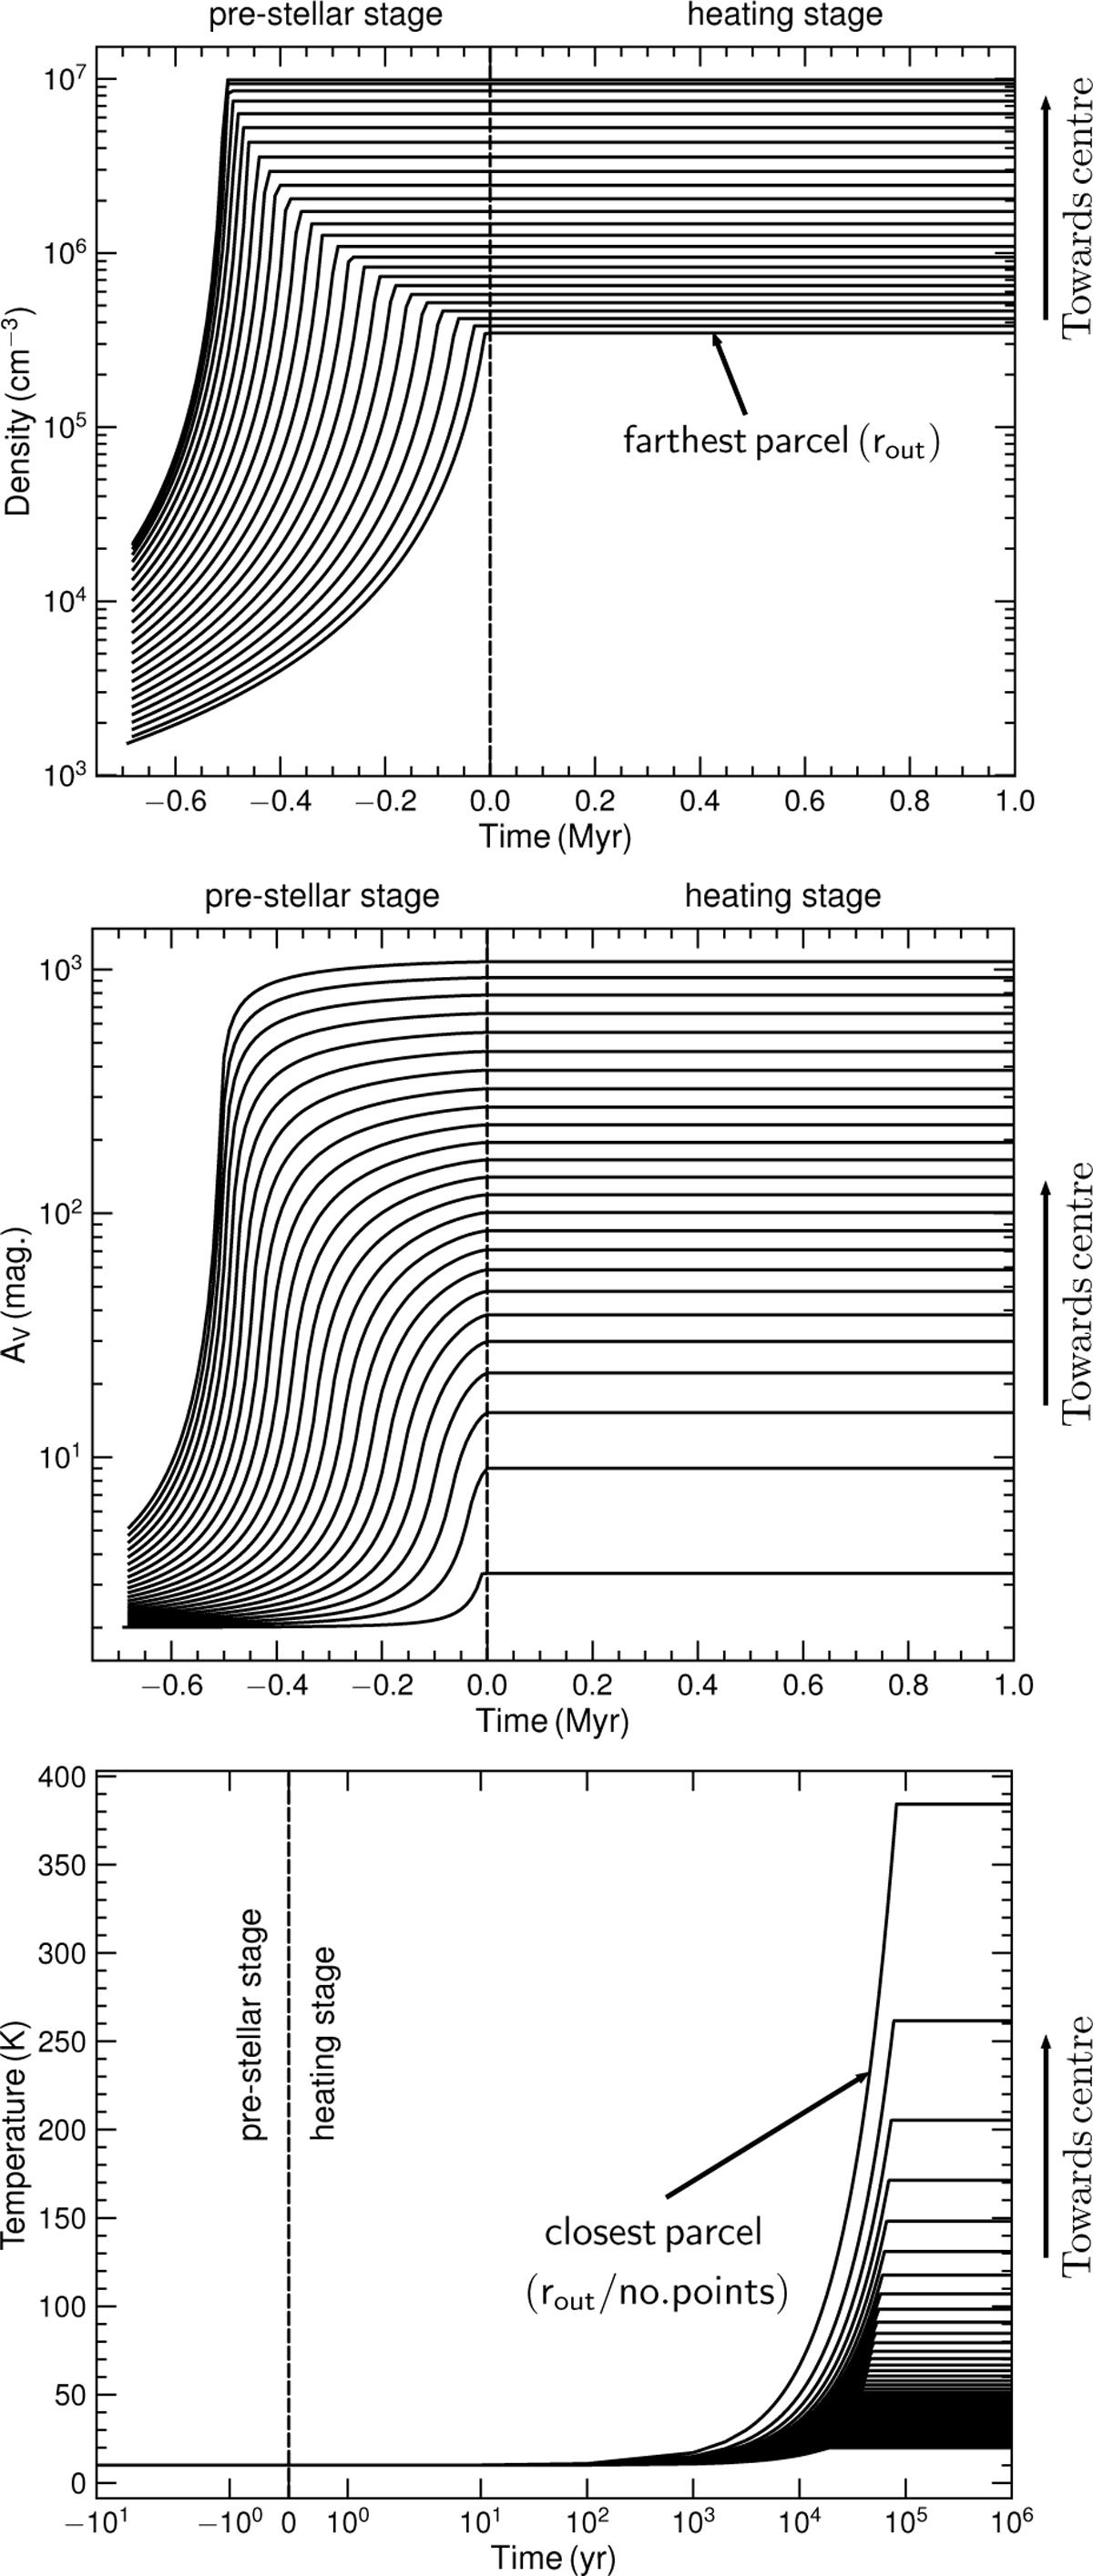
Examples of the profiles of the gas density (top), visual extinction from the surface (middle) and temperature (bottom). The negative time is for the pre-stellar phase, and a time of zero is when the protostar is formed. For visualisation purposes, 50 of the 100 gas parcels in the sampling are shown. The values of ngas(r) estimated by Eq. (1) and the Td(r) estimated by Eq. (9) are the final values of ngas(t) in Eq. (10) and Td(t) in Eq. (13) at a given location r. These profiles have L* = 105 L⊙, nin = 107 cm−3, rflat=0.05 pc and a = 0.5 μm.
Current usage metrics show cumulative count of Article Views (full-text article views including HTML views, PDF and ePub downloads, according to the available data) and Abstracts Views on Vision4Press platform.
Data correspond to usage on the plateform after 2015. The current usage metrics is available 48-96 hours after online publication and is updated daily on week days.
Initial download of the metrics may take a while.