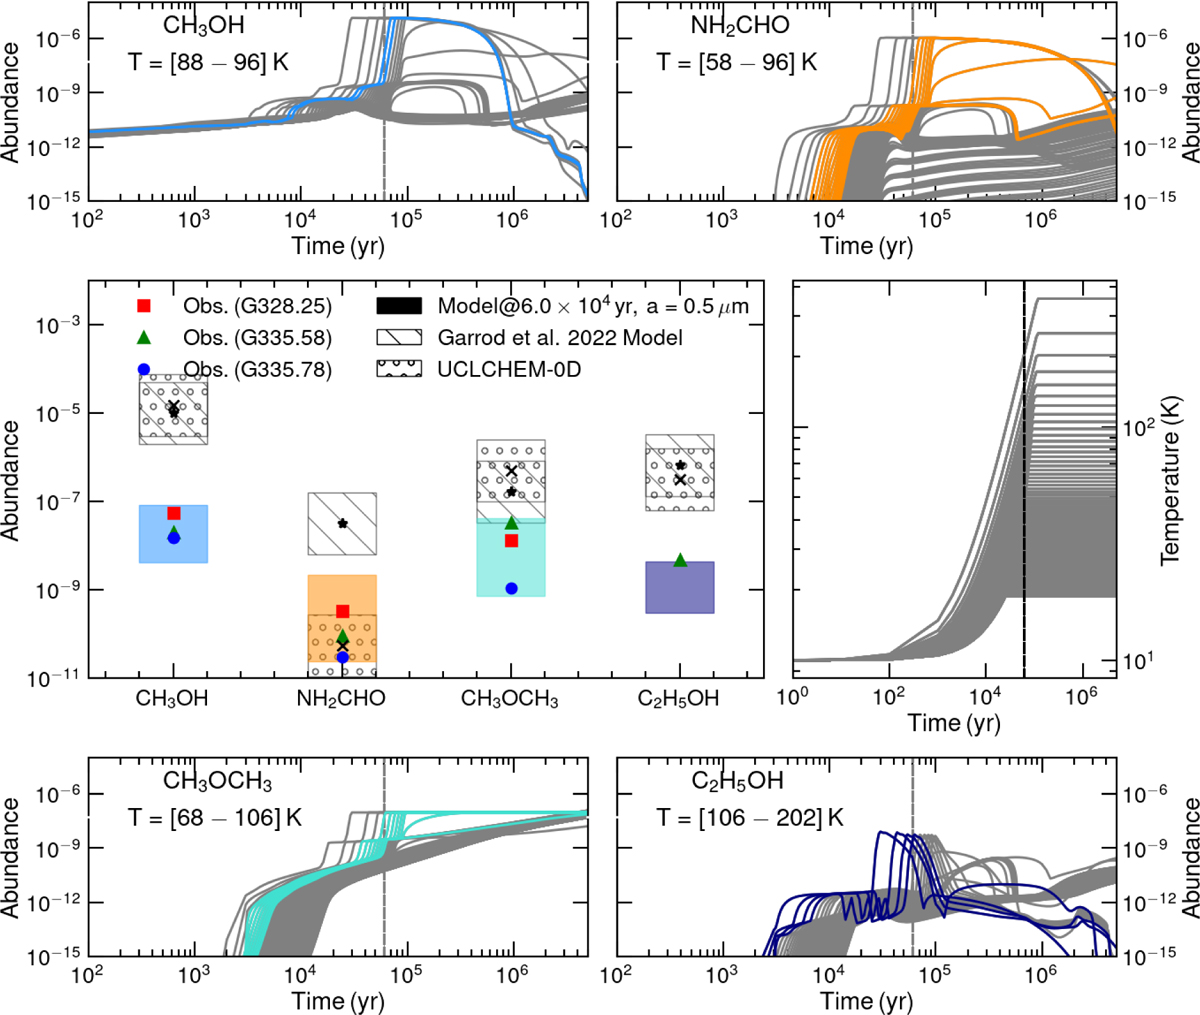
Fig. 8
Download original image
Comparison between the model and observations of G328.25, G335.58 and G335.78. Middle left: lower and upper bounds of the model that best cover the observations at a given time of 6 × 10⁴ yr with a grain size of 0.5 μm. These areas of best coverage relate to various locations in the envelope; they are marked by the lines in the top and bottom panels, which are colour-coded by temperature. Comparisons with the 0D model (UCLCHEM-0D with G0=1 and Garrod et al. 2022) are also provided; mean prediction values are shown with ‘x’ symbols and asterisks, while the hatched lines boxes mark a factor of 5 scatter around these mean values. Middle right: temperature profile for all locations in our model.
Current usage metrics show cumulative count of Article Views (full-text article views including HTML views, PDF and ePub downloads, according to the available data) and Abstracts Views on Vision4Press platform.
Data correspond to usage on the plateform after 2015. The current usage metrics is available 48-96 hours after online publication and is updated daily on week days.
Initial download of the metrics may take a while.