Fig. 1
Download original image
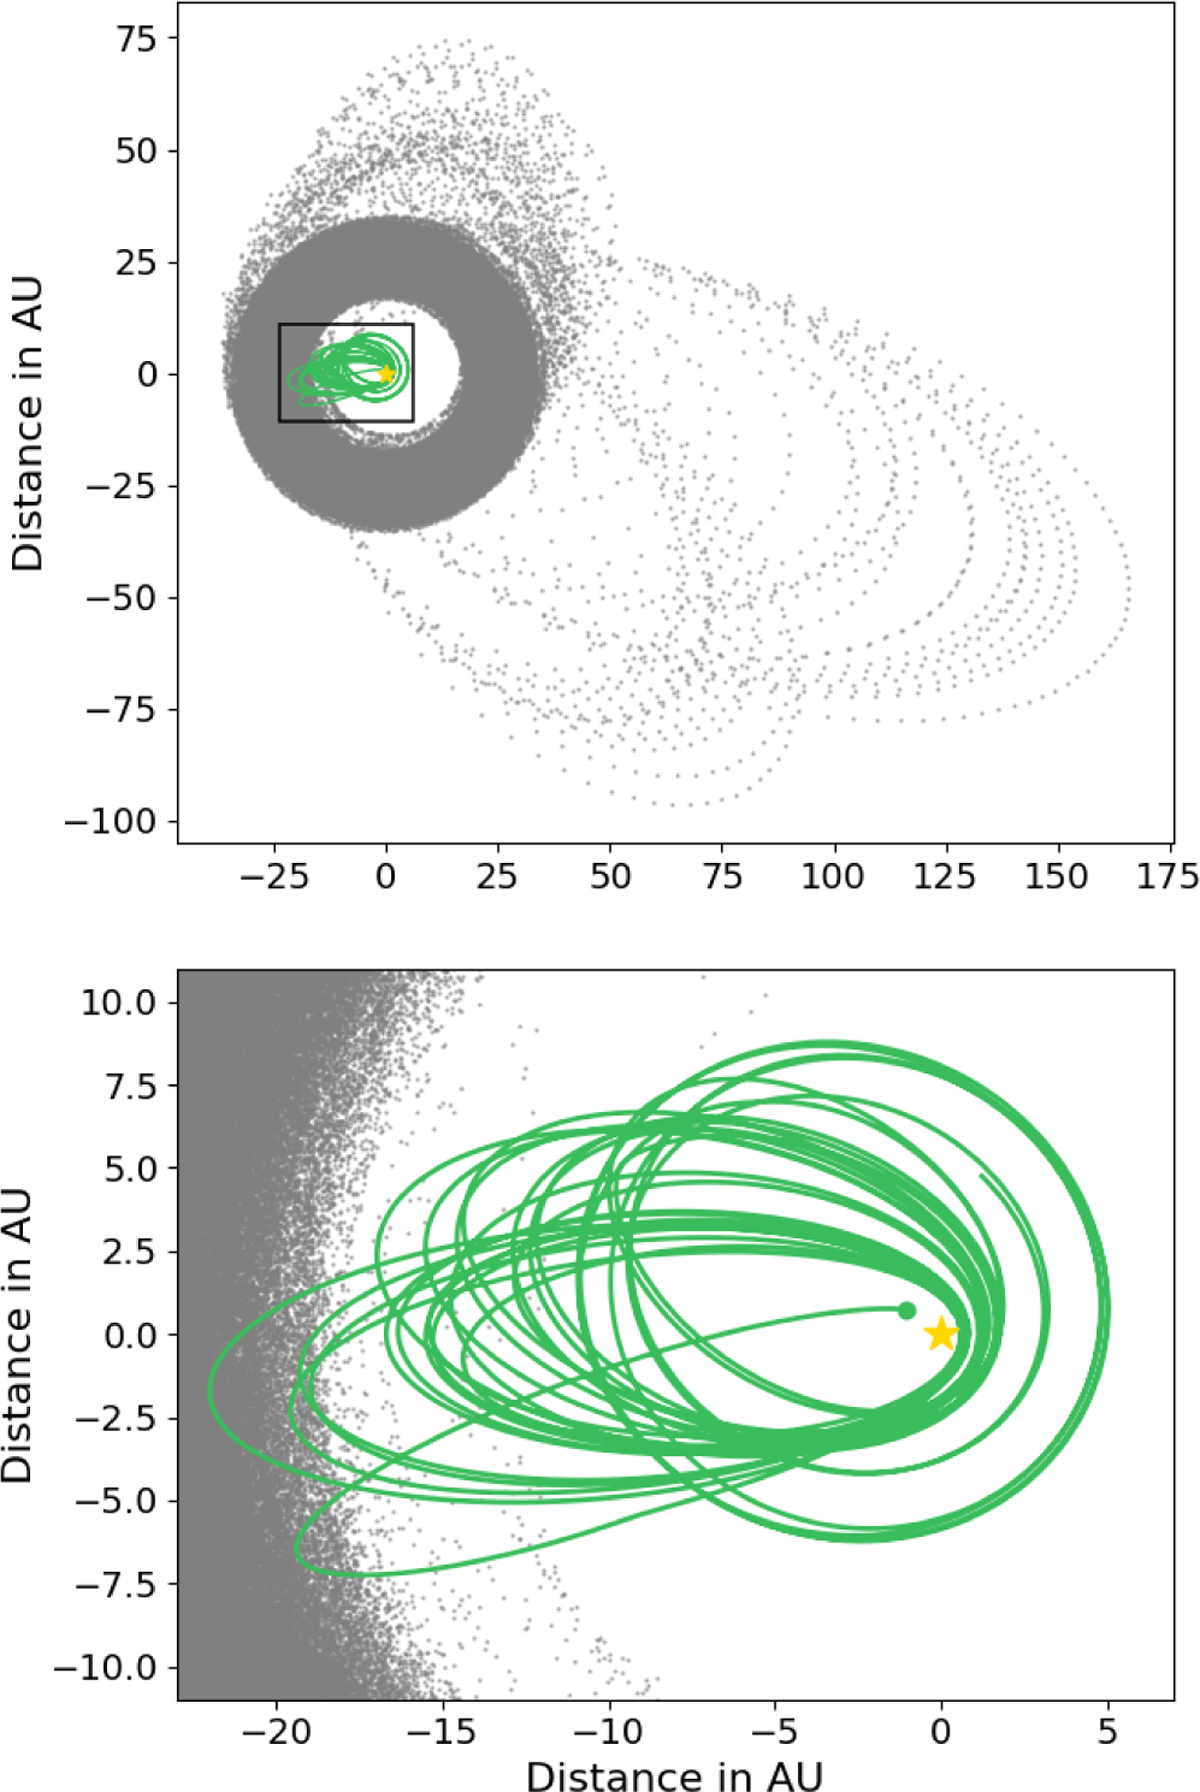
Example of the orbit of a simulated test particle initiated with a = 25.73 AU. The grey points show the orbit computed during the low-resolution simulation. The particle initially undergoes interactions with β Pic b and reaches a periastron distance of less than 3 AU at some moment in the simulation. Then the resolution of the simulation is increased, resulting in the orbit shown in green. This high-resolution simulation ends when the periastron distance becomes less than 0.4 AU (marked with the green dot).
Current usage metrics show cumulative count of Article Views (full-text article views including HTML views, PDF and ePub downloads, according to the available data) and Abstracts Views on Vision4Press platform.
Data correspond to usage on the plateform after 2015. The current usage metrics is available 48-96 hours after online publication and is updated daily on week days.
Initial download of the metrics may take a while.