Fig. 3
Download original image
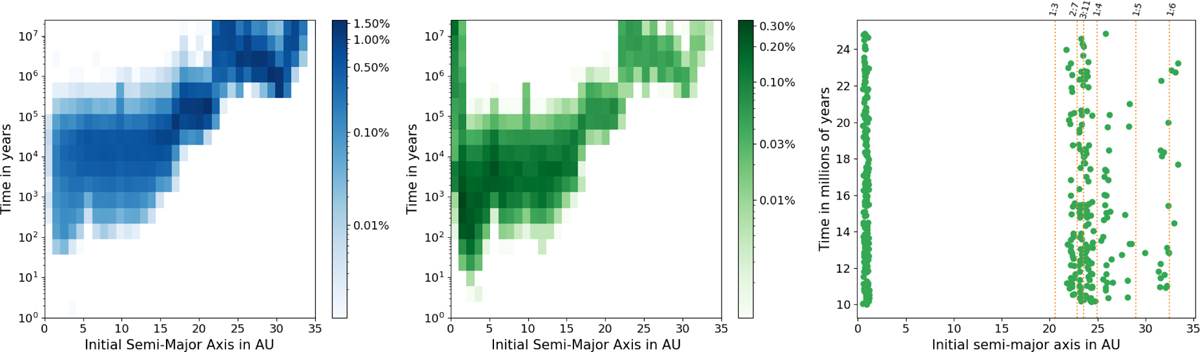
Time dependence of the evolution of test particles. The two left-most panels show the survival times of particles that get ejected (left-most) or are star-grazing (middle), as a function of the initial semi-major axis at which the particles are seeded. The percentage of all simulated particles that is removed from the simulation is indicated with the colourbar. The right-most panel shows particles that become classified as star-grazing after 10 million years. We call these ‘late star-grazers’ and investigate them in further detail in Sect. 3.2. Note: there seem to be two different sources of late star-grazers, in the inner and outer parts of the system, respectively. Orbital resonances with β Pic b are also indicated such as in Fig. 2, clearly showing that star-grazers are not expected to be produced from low-order resonances (e.g. 1:3 and 1:4) because these have been cleared earlier in the life of the system.
Current usage metrics show cumulative count of Article Views (full-text article views including HTML views, PDF and ePub downloads, according to the available data) and Abstracts Views on Vision4Press platform.
Data correspond to usage on the plateform after 2015. The current usage metrics is available 48-96 hours after online publication and is updated daily on week days.
Initial download of the metrics may take a while.