Fig. A.1
Download original image
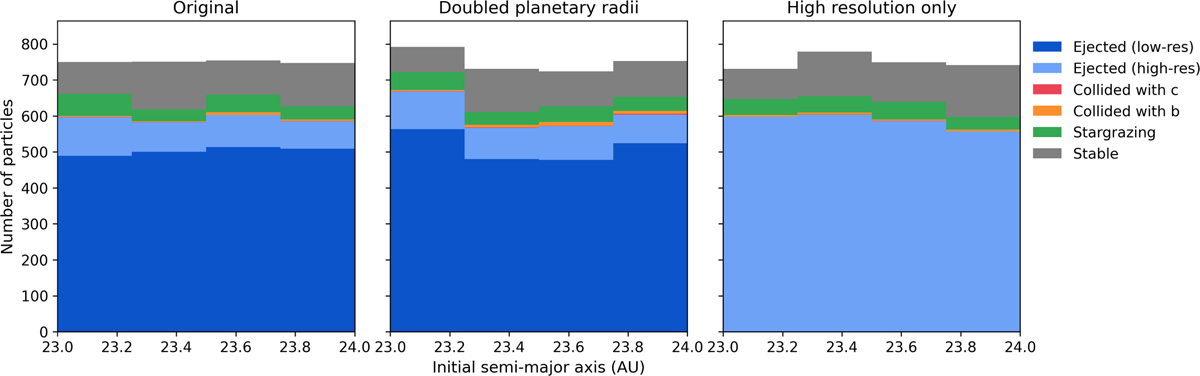
Branching ratios of the region between 23 and 24 AU. The left-most panel shows a zoom-in of Fig. 2, where the simulation was performed using the same set-up as the one presented in Sect. 2.1. The middle panel shows the resulting branching ratios of the same region from a simulation where the planetary radii used were doubled. Similarly, the right-most panel shows the branching ratios of this region resulting from a simulation following the set-up as described in Sect. 2.1, but in which all particles were simulated using only the high-resolution time step.
Current usage metrics show cumulative count of Article Views (full-text article views including HTML views, PDF and ePub downloads, according to the available data) and Abstracts Views on Vision4Press platform.
Data correspond to usage on the plateform after 2015. The current usage metrics is available 48-96 hours after online publication and is updated daily on week days.
Initial download of the metrics may take a while.