Fig. 4.
Download original image
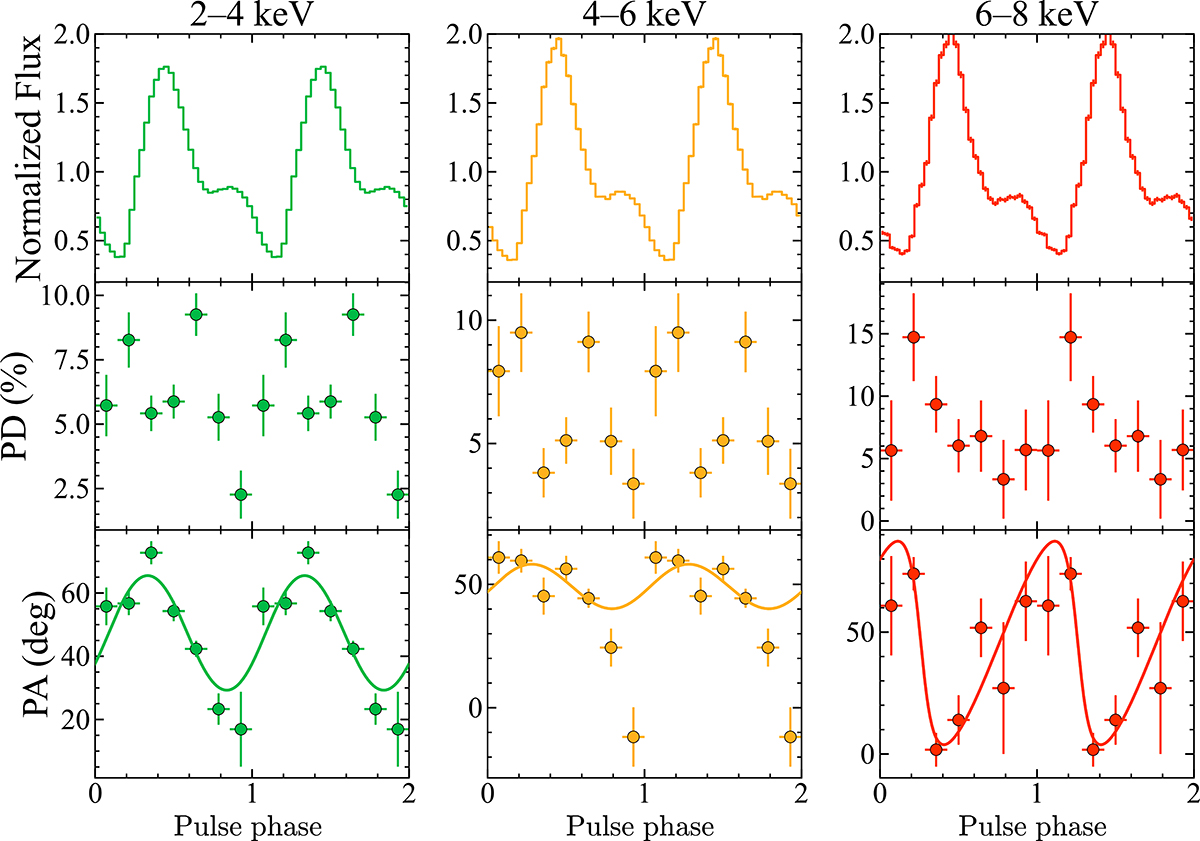
Pulse phase-resolved, energy-dependent polarimetric results. Top panels: Normalized pulse profiles in three energy bands. Middle panels: Variations of PD with pulse phase. Bottom panels: Variations of PA with pulse phase. The 2–4, 4–6, and 6–8 keV bands are shown in the left, middle, and right columns and are color-coded in green, orange, and red, respectively. The solid curves in the bottom panels represent the best-fitting single-component RVM models applied to the PA data.
Current usage metrics show cumulative count of Article Views (full-text article views including HTML views, PDF and ePub downloads, according to the available data) and Abstracts Views on Vision4Press platform.
Data correspond to usage on the plateform after 2015. The current usage metrics is available 48-96 hours after online publication and is updated daily on week days.
Initial download of the metrics may take a while.