Open Access
Fig. 6.
Download original image
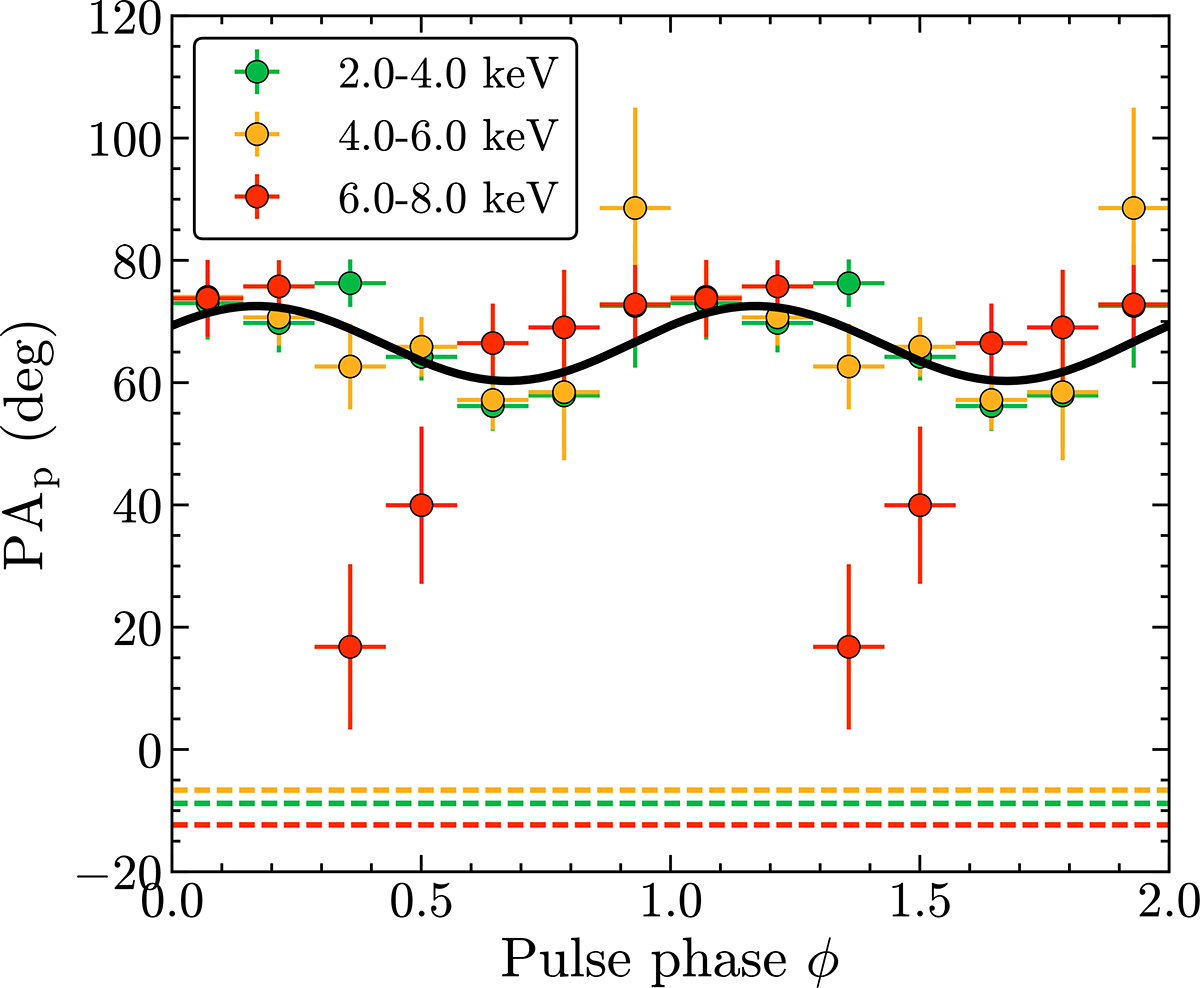
PA for the pulsed components of Cen X-3 in different energy bands, as indicated by the colored points. The constant components are shown as dashed lines. The solid black line represents the joint RVM fit for the three energy bands after subtraction of the constant components. The color coding is the same as in Fig. 4.
Current usage metrics show cumulative count of Article Views (full-text article views including HTML views, PDF and ePub downloads, according to the available data) and Abstracts Views on Vision4Press platform.
Data correspond to usage on the plateform after 2015. The current usage metrics is available 48-96 hours after online publication and is updated daily on week days.
Initial download of the metrics may take a while.