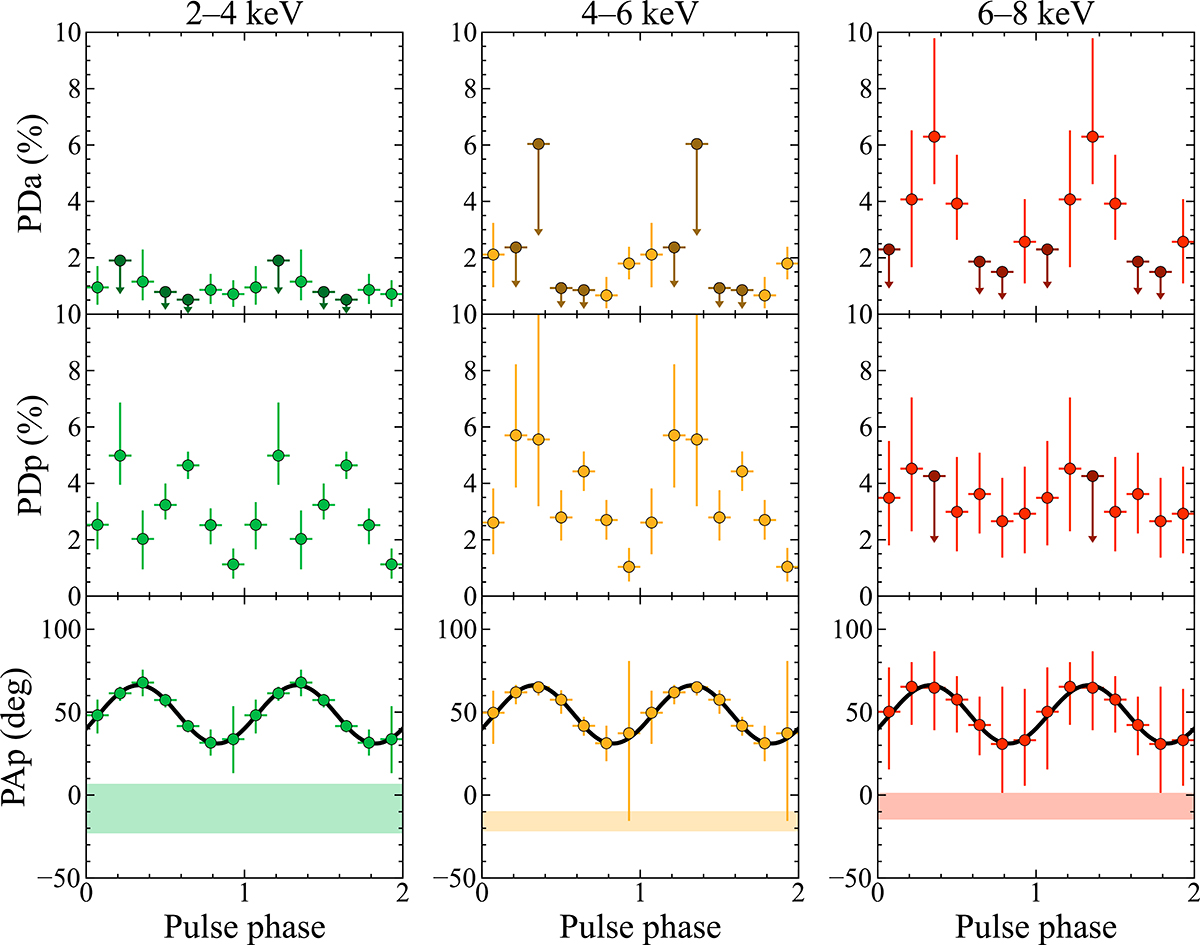
Fig. 8.
Download original image
Pulse phase-resolved polarization properties decomposed into pulsed and additional components for each energy band. Top: PDs (in total flux) of the additional component (PDa). Middle: PDs of the pulsed component (PDp). When the PDs are detected with a confidence level below 68% (1σ), the corresponding 1σ upper limits are shown as downward arrows in darker colors. Bottom: PA of the pulsed component (PAp) versus pulse phase. The shaded horizontal bands indicate the phase-independent PAs of the additional component, while the solid black curves represent the best-fit RVM to the pulsed component.
Current usage metrics show cumulative count of Article Views (full-text article views including HTML views, PDF and ePub downloads, according to the available data) and Abstracts Views on Vision4Press platform.
Data correspond to usage on the plateform after 2015. The current usage metrics is available 48-96 hours after online publication and is updated daily on week days.
Initial download of the metrics may take a while.