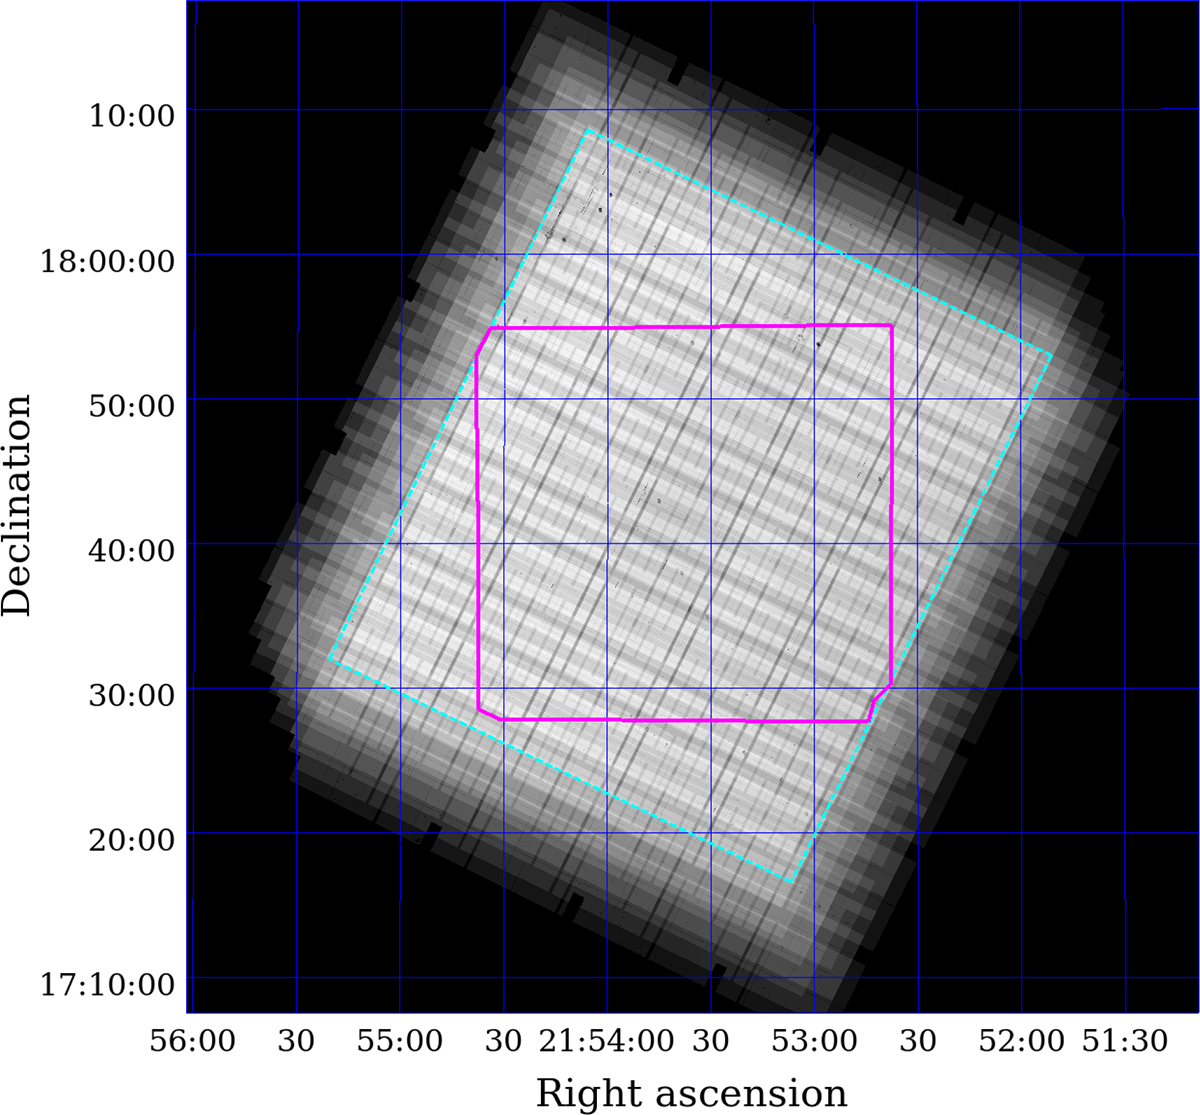
Fig. 1.
Download original image
Field coverage. The grey-scale shows the weight image of the VIS image stack on a linear scale. The magenta solid polygon indicates the main region of interest for this WL analysis, where both the Euclid image stacks have their greatest depth and multi-band ground-based observations are available. The cyan dashed polygon indicates the full-depth VIS area employed in the source injection analysis (see Sect. 5.2).
Current usage metrics show cumulative count of Article Views (full-text article views including HTML views, PDF and ePub downloads, according to the available data) and Abstracts Views on Vision4Press platform.
Data correspond to usage on the plateform after 2015. The current usage metrics is available 48-96 hours after online publication and is updated daily on week days.
Initial download of the metrics may take a while.