Fig. 10.
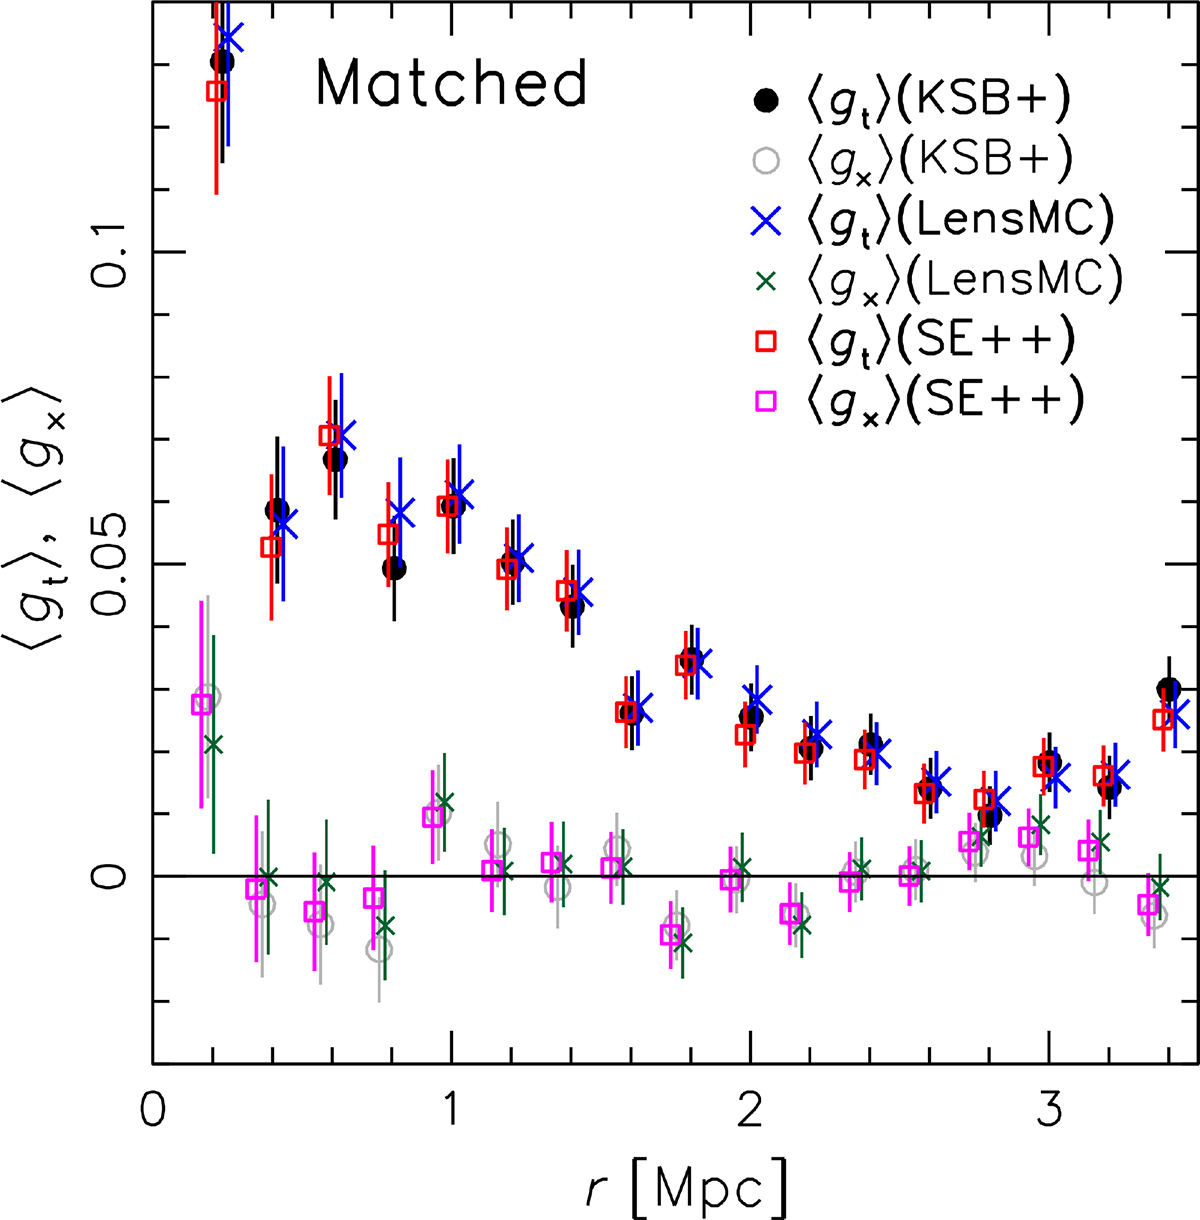
Download original image
Matched-sample comparison of the raw reduced shear profiles (prior to the background selection and contamination correction) obtained from the three shape catalogues, showing both the tangential component ⟨gt⟩ and the cross-component ⟨g×⟩. In the average computation we only include sources that have non-zero shape weights as computed by all three methods. The error bars include shape noise and are therefore correlated between the methods, explaining why the tangential reduced shear profiles obtained by the three methods differ from each other to a lesser extent than the error bars. For the KSB+ catalogue ⟨gt⟩ is plotted at the correct position, while the other data points have been offset along the x-axis for clarity.
Current usage metrics show cumulative count of Article Views (full-text article views including HTML views, PDF and ePub downloads, according to the available data) and Abstracts Views on Vision4Press platform.
Data correspond to usage on the plateform after 2015. The current usage metrics is available 48-96 hours after online publication and is updated daily on week days.
Initial download of the metrics may take a while.