Fig. 15.
Download original image
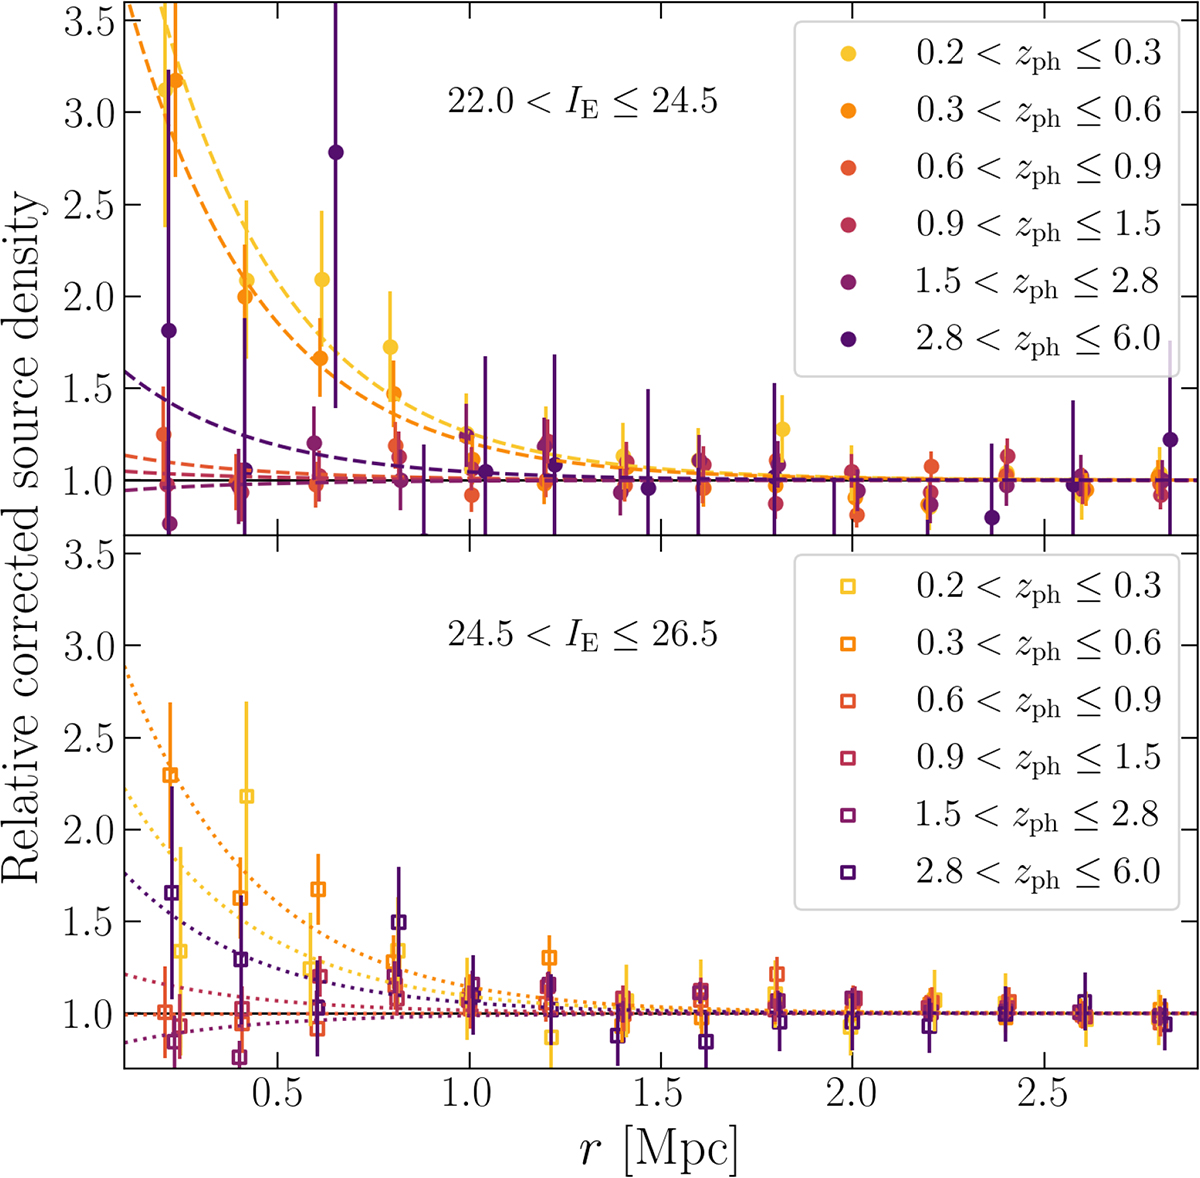
Source number density profiles after correction for the impact of source obscuration and magnification, scaled to the corresponding mean value of the three outermost annuli. The increase over the baseline is a direct measure of the boost factor that we need to apply to compensate for cluster member contamination. We show an exponential model fit as dashed (22.0 < IE < 24.5) and dotted (24.5 < IE < 26.5) curves.
Current usage metrics show cumulative count of Article Views (full-text article views including HTML views, PDF and ePub downloads, according to the available data) and Abstracts Views on Vision4Press platform.
Data correspond to usage on the plateform after 2015. The current usage metrics is available 48-96 hours after online publication and is updated daily on week days.
Initial download of the metrics may take a while.