Fig. 16.
Download original image
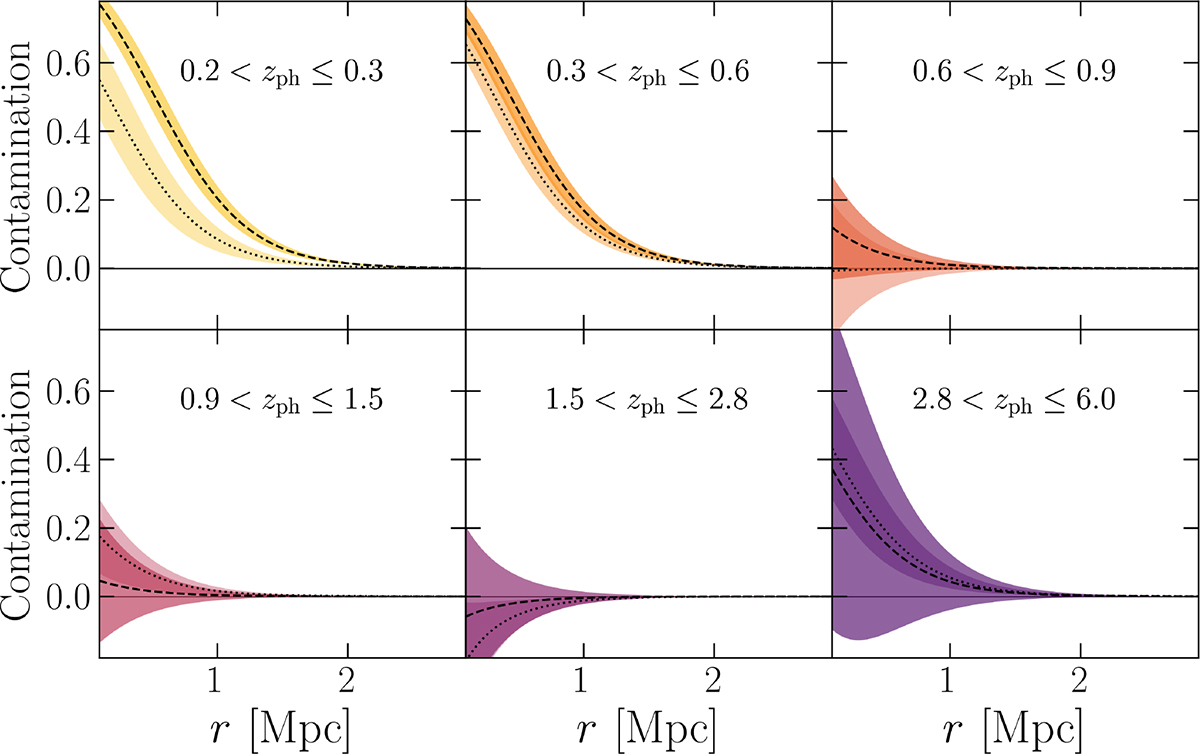
Contamination profiles for the KSB+ lensing sample based on the fits of the obscuration- and magnification-corrected radial source density profiles for the different tomographic redshift and magnitude bin combinations. Dashed lines correspond to the bright sample (22.0 < IE < 24.5), while dotted lines show the profiles for the faint sample (24.5 < IE < 26.5). The shaded areas represent the ±1σ uncertainties of the model fit.
Current usage metrics show cumulative count of Article Views (full-text article views including HTML views, PDF and ePub downloads, according to the available data) and Abstracts Views on Vision4Press platform.
Data correspond to usage on the plateform after 2015. The current usage metrics is available 48-96 hours after online publication and is updated daily on week days.
Initial download of the metrics may take a while.