Fig. 19.
Download original image
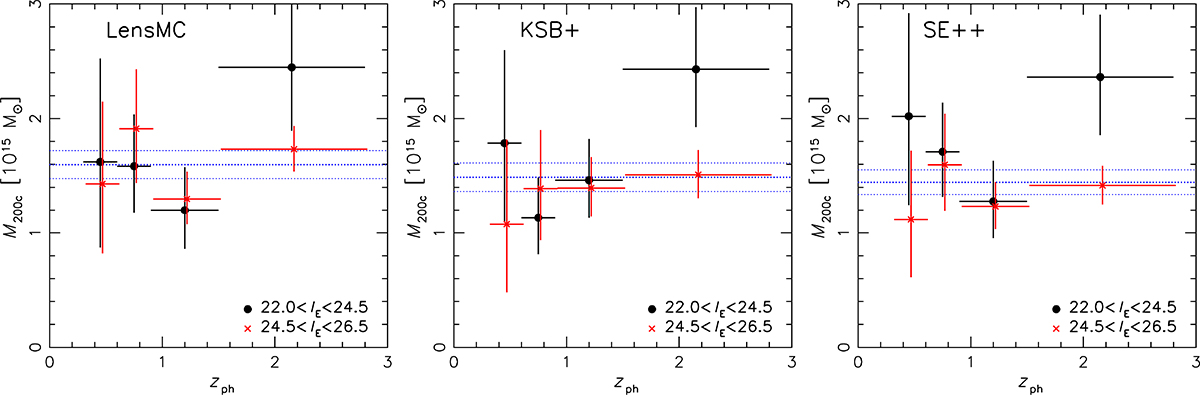
WL constraints on M200c based on the LensMC (left), KSB+ (middle), and SE++ (right) shear estimates. The dashed blue lines show the average and 1 σ uncertainty range, while the symbols show the individual constraints from the different magnitude and photometric redshift bin combinations. The black circles show the bright magnitude bins and are plotted at the bin centre with horizontal error bars indicating the bin width. The red crosses show the results from the faint magnitude bin and have been offset by Δzph = 0.02 for clarity. To translate the indicated photometric redshift ranges into estimated true redshift distributions see Fig. 5. All results assume a fixed concentration c200c = 4, with plotted mass uncertainties corresponding to shape noise only.
Current usage metrics show cumulative count of Article Views (full-text article views including HTML views, PDF and ePub downloads, according to the available data) and Abstracts Views on Vision4Press platform.
Data correspond to usage on the plateform after 2015. The current usage metrics is available 48-96 hours after online publication and is updated daily on week days.
Initial download of the metrics may take a while.