Fig. 20.
Download original image
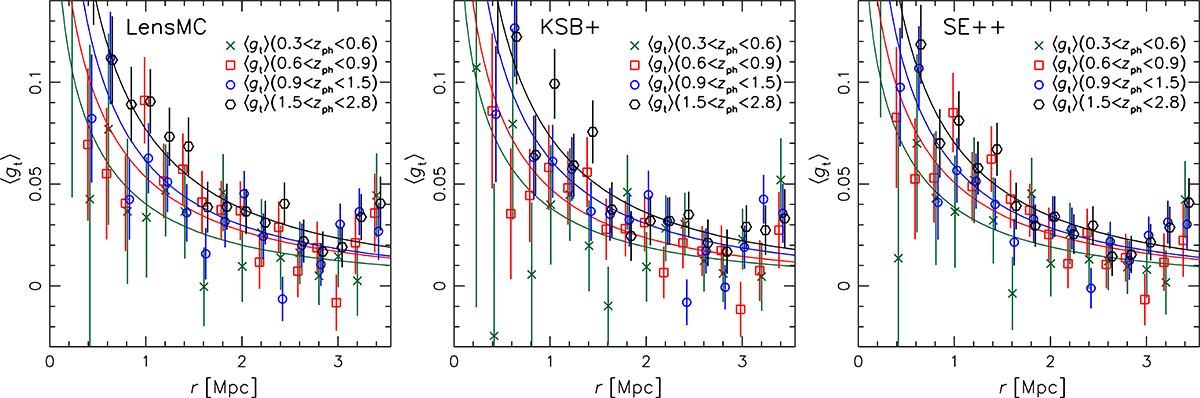
Magnitude-bin-combined contamination-corrected tangential reduced shear ⟨gt⟩(r) profiles of A2390 based on the LensMC (left), KSB+ (middle), and SE++ (right) shear estimates. For this figure, the individual noisy ⟨gt⟩(r) profiles of the two magnitude bins have been combined (slightly scaled to their average mean ⟨β⟩) to yield a single ⟨gt⟩(r) profile for each tomographic redshift bin. For each set of data points the curve plotted in the same colour shows the correspondingly averaged NFW reduced shear profile model for the jointly constrained best-fit cluster mass, assuming a fixed concentration c200c = 4. The data and model for the tomographic bin with 0.3 < zph < 0.6 is shown at the correct position, while the points and models of the other tomographic bins have been shifted consistently along the x-axis for clarity.
Current usage metrics show cumulative count of Article Views (full-text article views including HTML views, PDF and ePub downloads, according to the available data) and Abstracts Views on Vision4Press platform.
Data correspond to usage on the plateform after 2015. The current usage metrics is available 48-96 hours after online publication and is updated daily on week days.
Initial download of the metrics may take a while.