Fig. 21.
Download original image
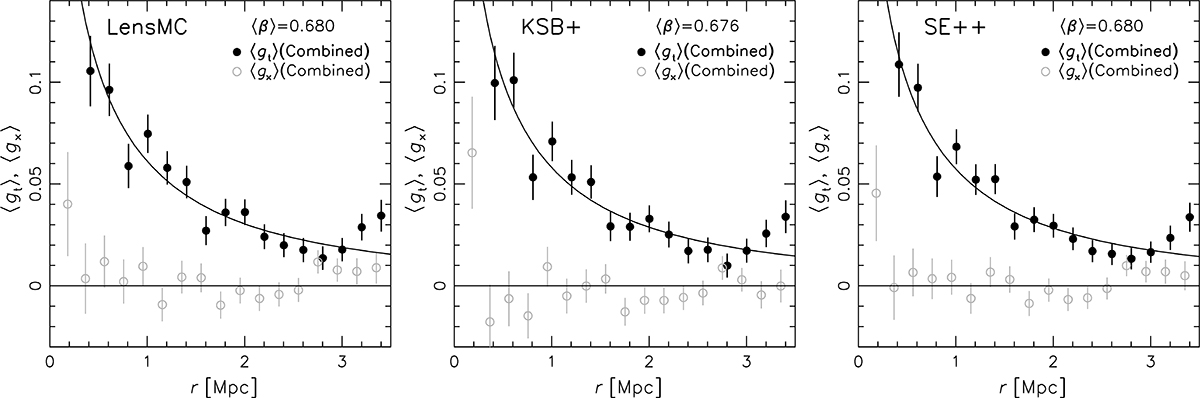
Combined contamination-corrected reduced shear profiles of A2390 based on the LensMC (left), KSB+ (middle) and SE++ (right) shear estimates. For this figure, the individual noisy reduced shear profiles of the different magnitude and photometric redshift bins have been rescaled to the effective mean ⟨β⟩ and combined, including all tomographic bins with 0.3 < zph < 2.8. The curves show the correspondingly averaged best-fit NFW model prediction for the tangential component assuming a fixed concentration c200c = 4.
Current usage metrics show cumulative count of Article Views (full-text article views including HTML views, PDF and ePub downloads, according to the available data) and Abstracts Views on Vision4Press platform.
Data correspond to usage on the plateform after 2015. The current usage metrics is available 48-96 hours after online publication and is updated daily on week days.
Initial download of the metrics may take a while.