Fig. 7.
Download original image
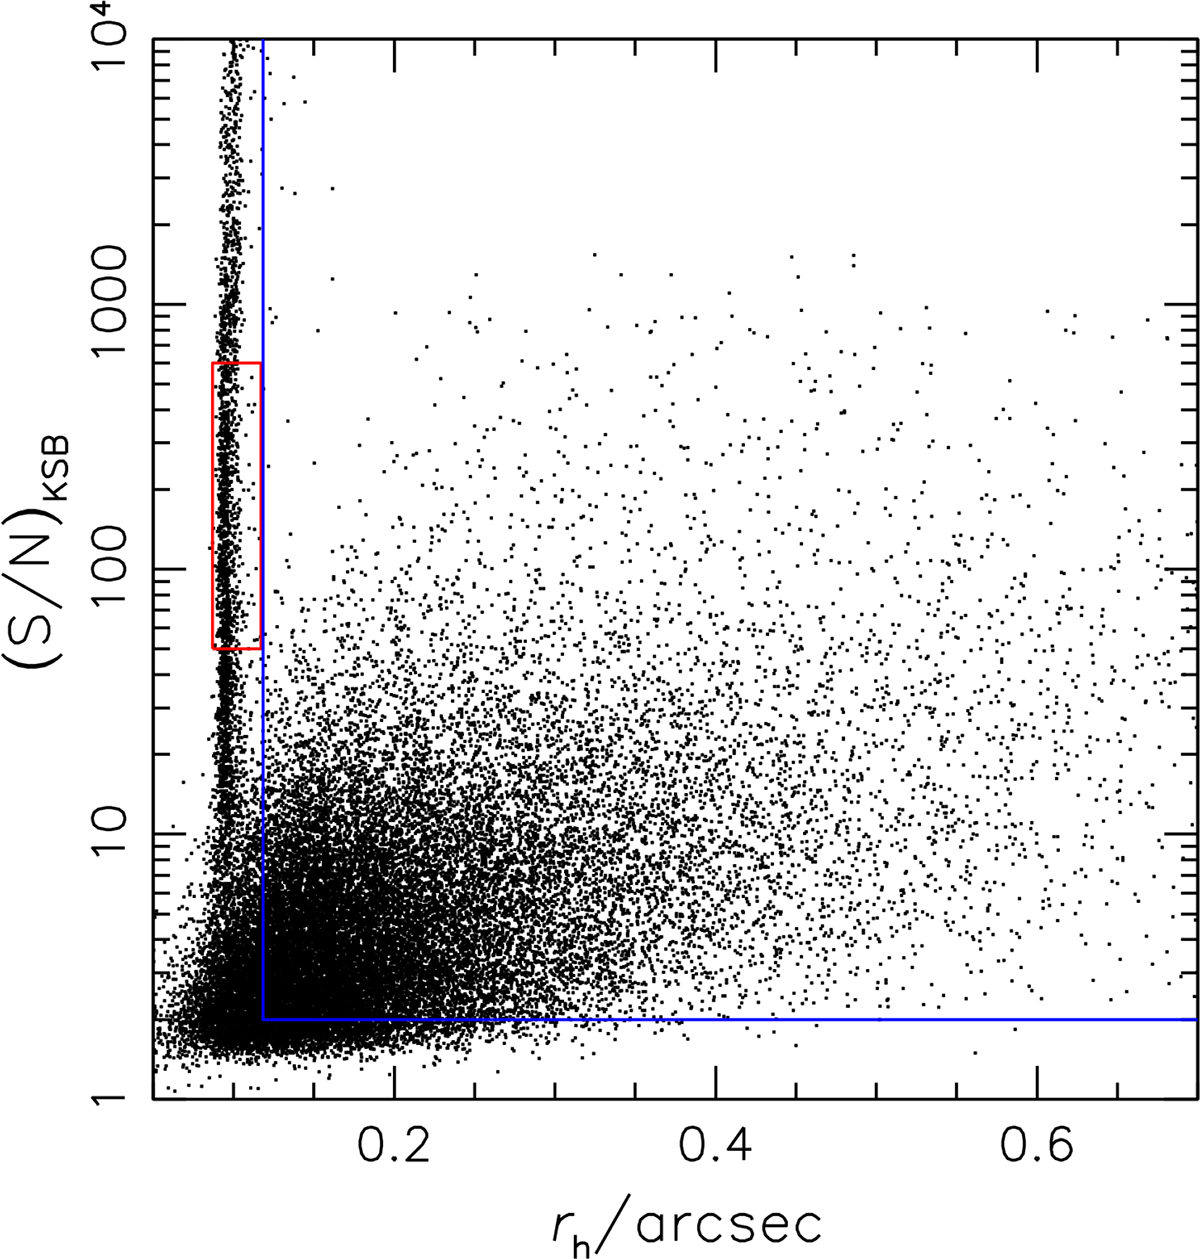
Distribution of S/NKSB versus rh for objects in the unfiltered KSB+ catalogue. The red box and blue lines indicate the pre-selection regions for the stars that are employed in the PSF modelling and for the galaxies, respectively. For clarity only a random sub-set of 20% of catalogue entries is displayed. Stars and noisy or poorly resolved galaxies are further removed from the shear catalogue via cuts in photometric redshift, magnitude, the SExtractor S/N, and additional KSB+ selections (see H20).
Current usage metrics show cumulative count of Article Views (full-text article views including HTML views, PDF and ePub downloads, according to the available data) and Abstracts Views on Vision4Press platform.
Data correspond to usage on the plateform after 2015. The current usage metrics is available 48-96 hours after online publication and is updated daily on week days.
Initial download of the metrics may take a while.