Fig. 8.
Download original image
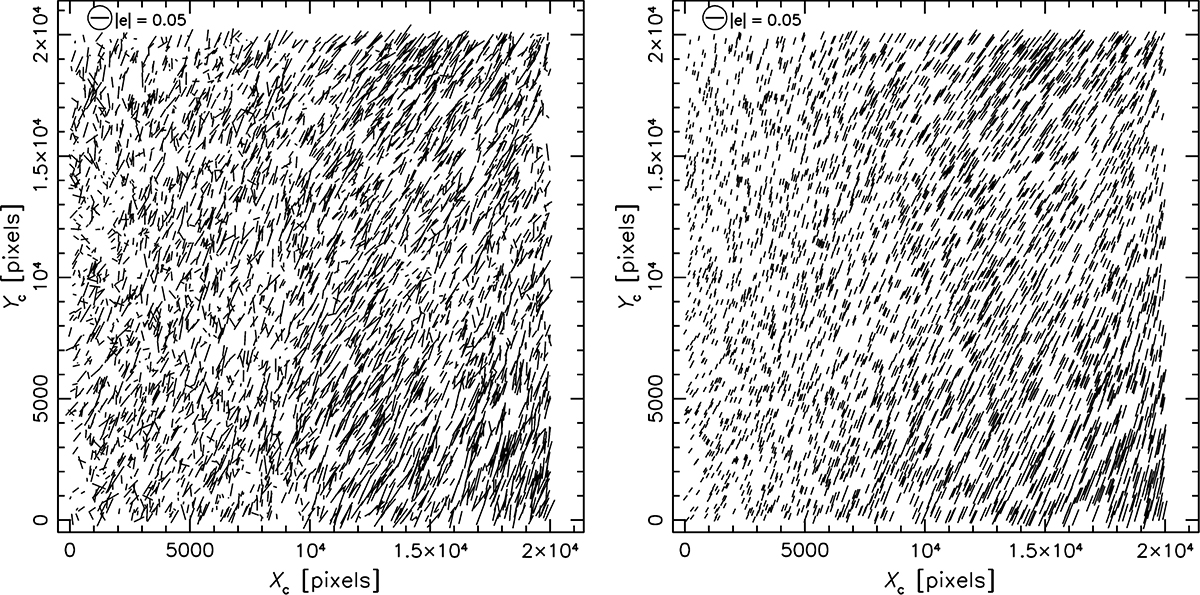
Spatial variation of the PSF polarisation eα measured using a KSB+ Gaussian filter scale ![]() (left panel) and its 2D third-order spatially interpolated model (right panel). Here we consider the central 20 000 × 20 000 pixels of this VIS stack (extending slightly beyond the primary WL region of interest; see Sect. 2.2), where the depicted coordinates (Xc, Yc) are related to the pixel positions in the stack (Xs, Ys) as (Xc, Yc) = (Xs − 10799, Ys − 10499). The whisker in the top left indicates a reference polarisation with |e| = 0.05.
(left panel) and its 2D third-order spatially interpolated model (right panel). Here we consider the central 20 000 × 20 000 pixels of this VIS stack (extending slightly beyond the primary WL region of interest; see Sect. 2.2), where the depicted coordinates (Xc, Yc) are related to the pixel positions in the stack (Xs, Ys) as (Xc, Yc) = (Xs − 10799, Ys − 10499). The whisker in the top left indicates a reference polarisation with |e| = 0.05.
Current usage metrics show cumulative count of Article Views (full-text article views including HTML views, PDF and ePub downloads, according to the available data) and Abstracts Views on Vision4Press platform.
Data correspond to usage on the plateform after 2015. The current usage metrics is available 48-96 hours after online publication and is updated daily on week days.
Initial download of the metrics may take a while.