Fig. 1
Download original image
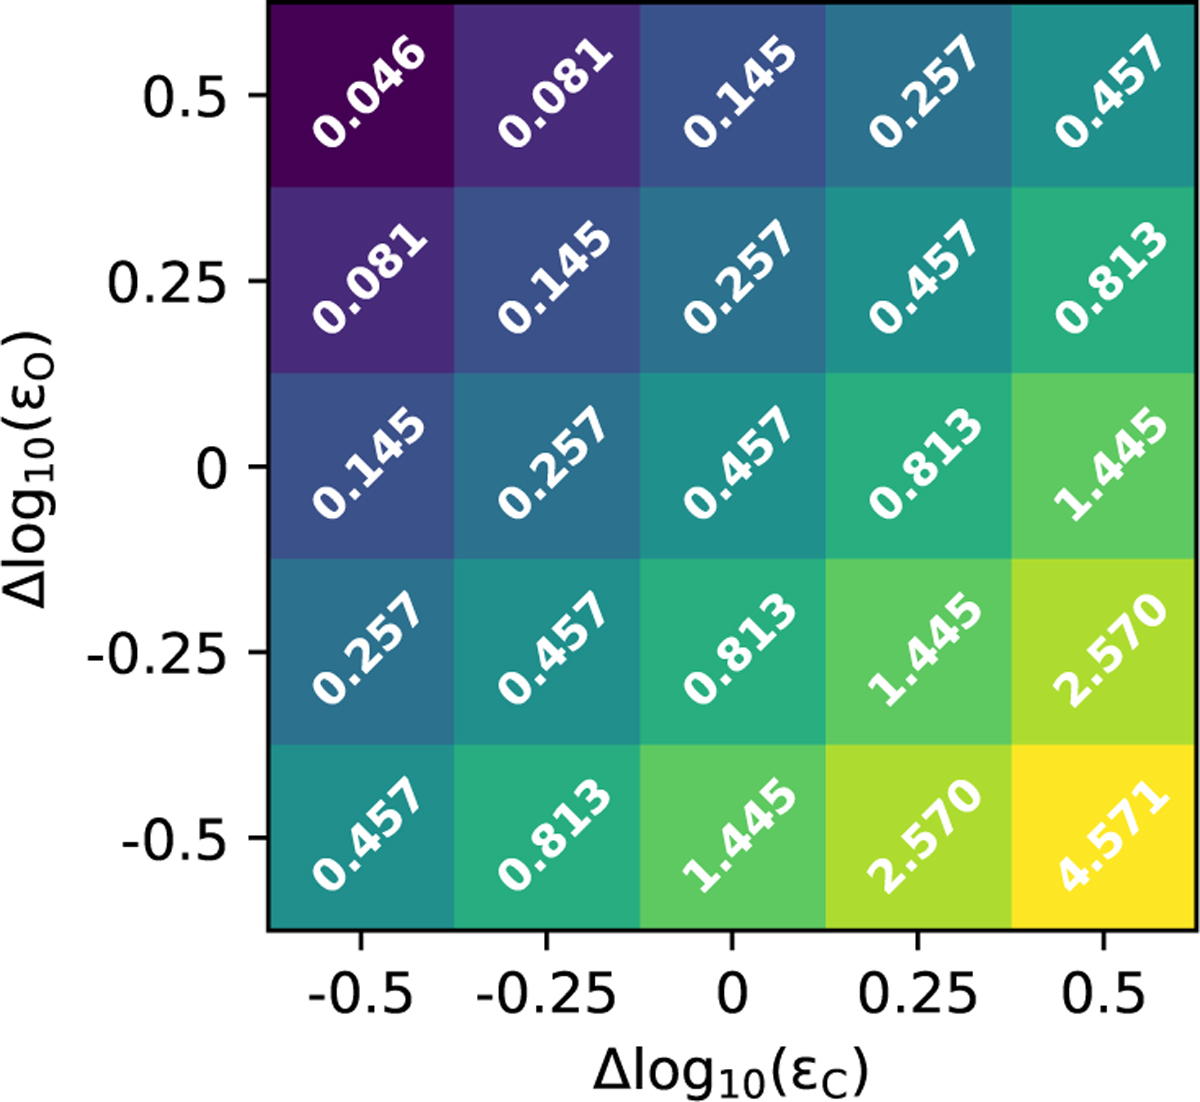
C/O ratios explored in the grid. The change in the carbon and oxygen elemental abundances relative to their fiducial abundances are shown in the x- and y-axes. The fiducial carbon and oxygen elemental abundances are listed in Table 1. Each square represents a model in the grid with the C/O ratio written on the square. The color of the square corresponds to the C/O ratio of the corresponding model.
Current usage metrics show cumulative count of Article Views (full-text article views including HTML views, PDF and ePub downloads, according to the available data) and Abstracts Views on Vision4Press platform.
Data correspond to usage on the plateform after 2015. The current usage metrics is available 48-96 hours after online publication and is updated daily on week days.
Initial download of the metrics may take a while.