Open Access
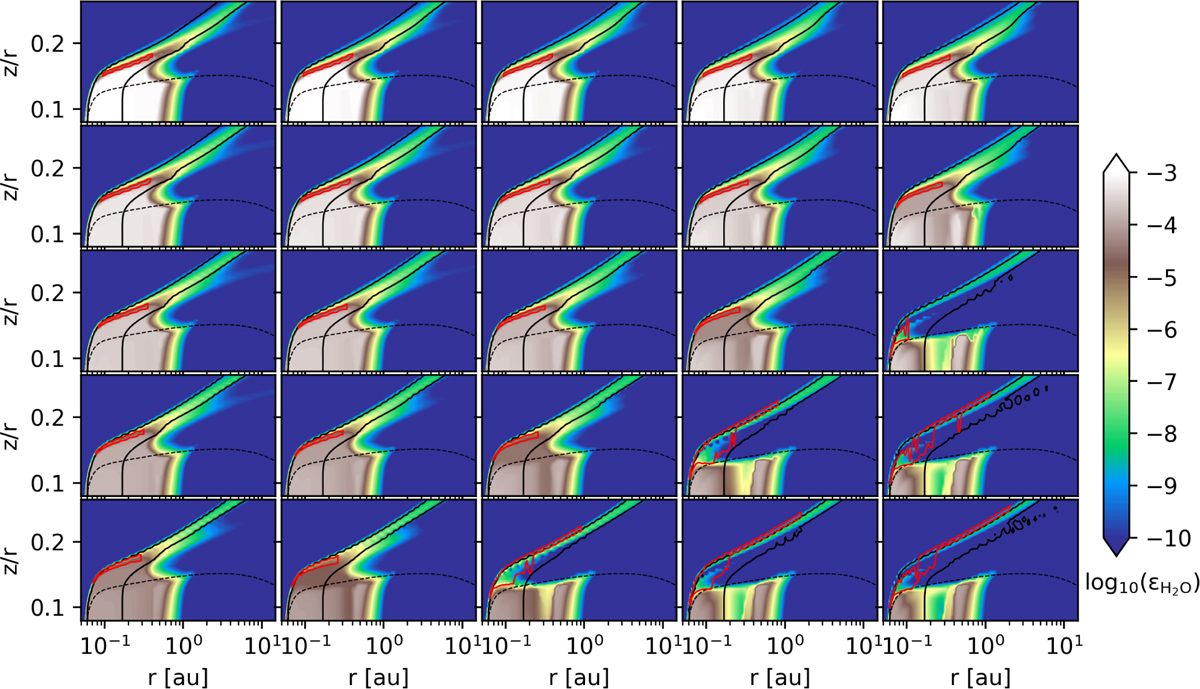
Fig. D.1
Download original image
Abundance and line emitting region (red line) of H2O. The solid black lines indicate the gas temperatures of 300 K and 1000 K, the dotted line indicates the ![]() line. Each panel corresponds to the same model illustrated in Fig.1.
line. Each panel corresponds to the same model illustrated in Fig.1.
Current usage metrics show cumulative count of Article Views (full-text article views including HTML views, PDF and ePub downloads, according to the available data) and Abstracts Views on Vision4Press platform.
Data correspond to usage on the plateform after 2015. The current usage metrics is available 48-96 hours after online publication and is updated daily on week days.
Initial download of the metrics may take a while.