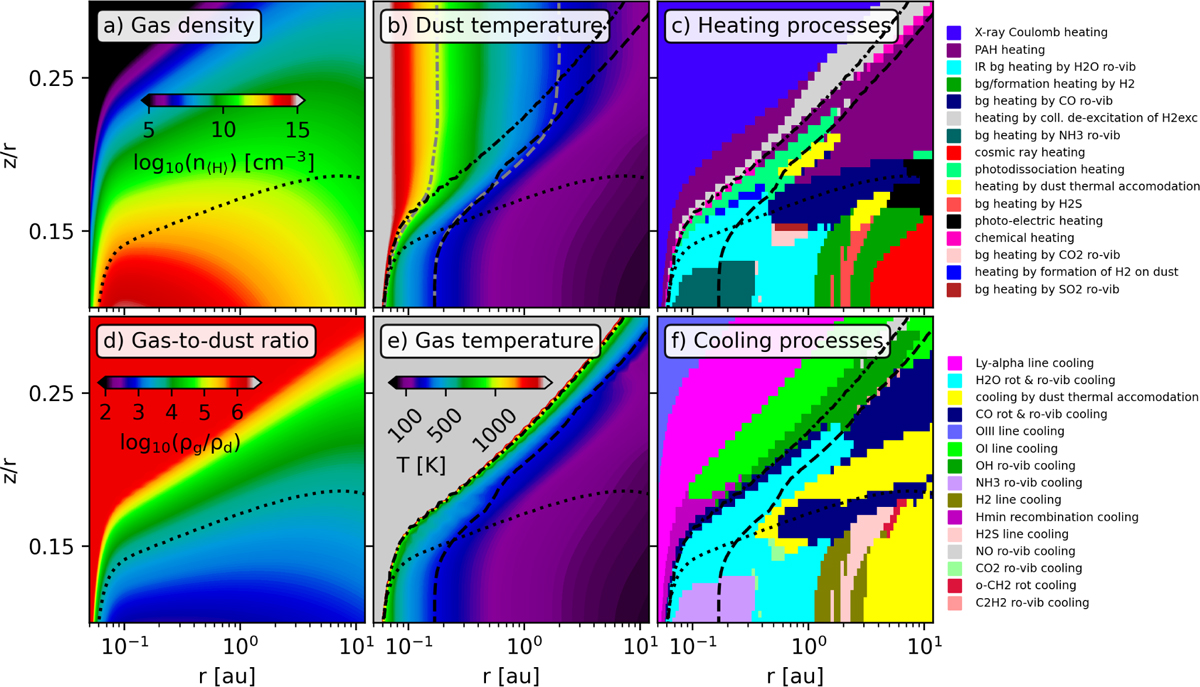
Fig. 2
Download original image
Disk structure of the fiducial model. Only the innermost 12 au and z/r>0.1 region, relevant to MIR emission, is shown. Left panels (a and d) show the gas density and the gas-to-dust mass ratio. Middle panels (b and e) show the dust and the gas temperatures. Right panels (c and f) show the dominant heating and cooling processes, which are labeled to the right of the respective panels. The dotted black line in each panel indicates the vertical extinction Av=1 line. The dashed and dash-dotted black lines show the 300 K and 1000 K gas temperature contours, respectively. The gray contours in panel b indicate the dust temperatures.
Current usage metrics show cumulative count of Article Views (full-text article views including HTML views, PDF and ePub downloads, according to the available data) and Abstracts Views on Vision4Press platform.
Data correspond to usage on the plateform after 2015. The current usage metrics is available 48-96 hours after online publication and is updated daily on week days.
Initial download of the metrics may take a while.