Fig. 4
Download original image
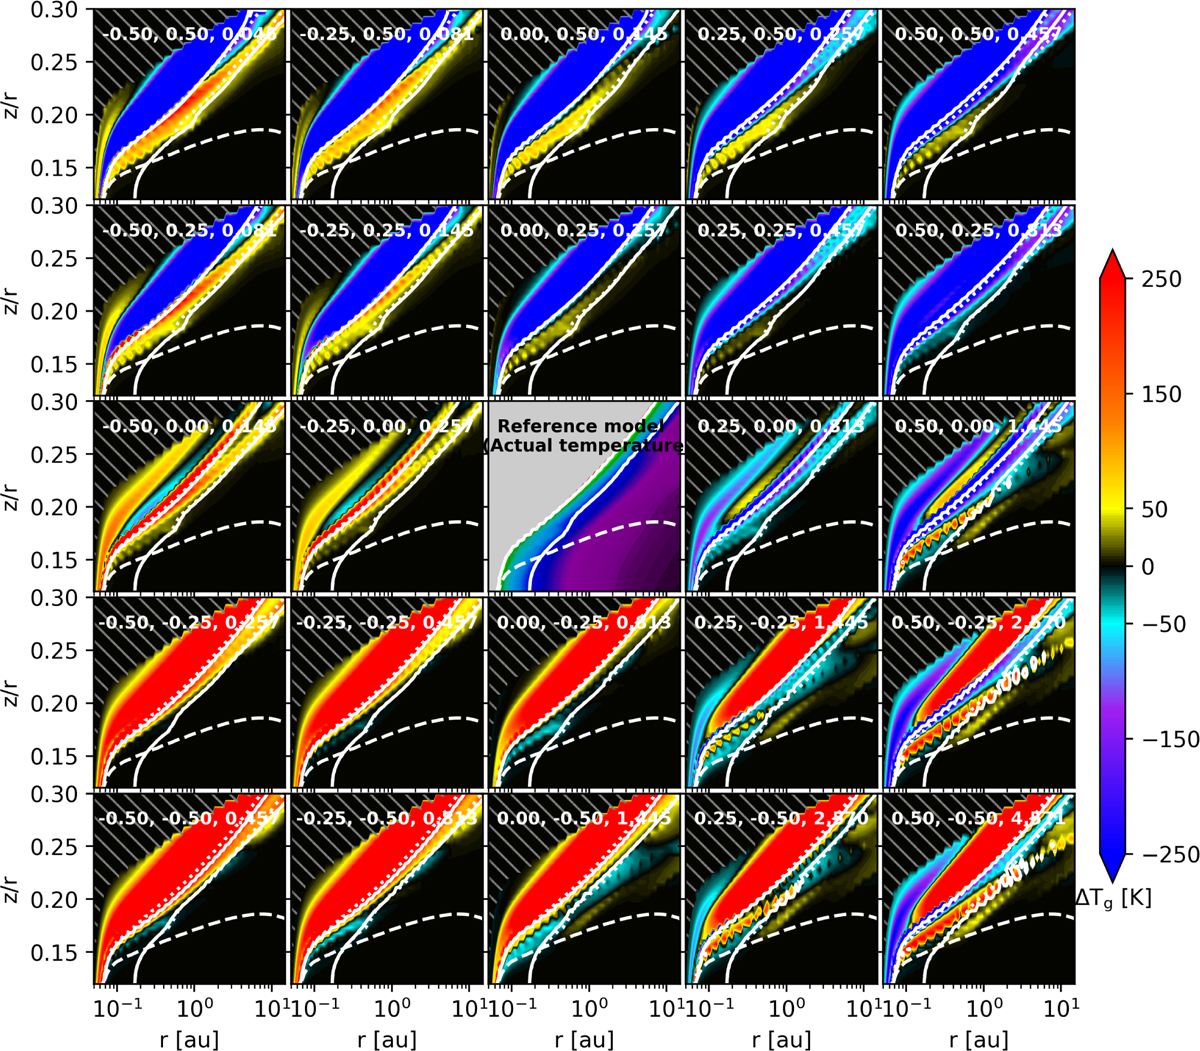
Difference in gas temperatures with respect to the fiducial model. White contours (solid lines) are gas temperatures of 300 K and 1000 K. The white dotted lines show the 300 K and 1000 K gas temperatures, and white dashed lines show Av=1 of the reference model. Since the gas and dust densities are the same for each model, the location of the Av=1 contour is the same in all panels. The center panel shows the actual gas temperature of the fiducial model, which is the same as panel e of Fig. 2. The text in each panel denotes Δ log10(ɛC), Δ log10(ɛO), and the C/O ratio.
Current usage metrics show cumulative count of Article Views (full-text article views including HTML views, PDF and ePub downloads, according to the available data) and Abstracts Views on Vision4Press platform.
Data correspond to usage on the plateform after 2015. The current usage metrics is available 48-96 hours after online publication and is updated daily on week days.
Initial download of the metrics may take a while.