Open Access
Fig. 6
Download original image
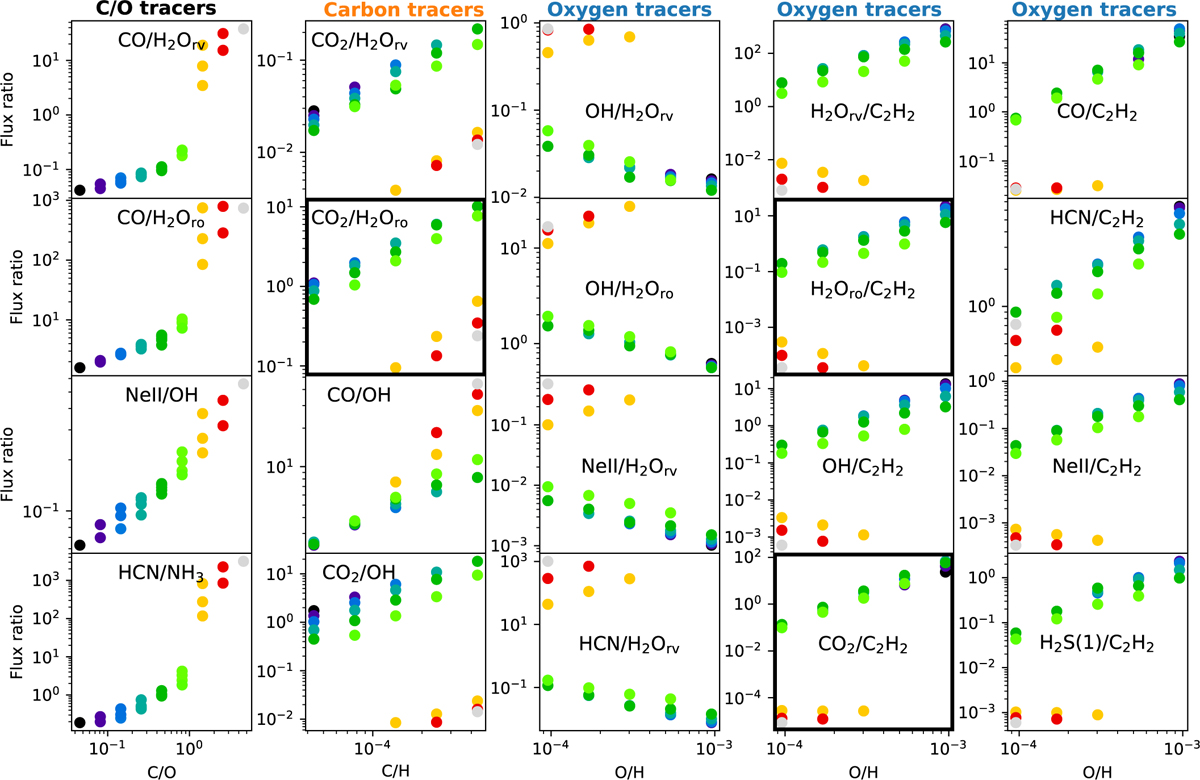
MIR molecular diagnostics: integrated flux ratios. The colors of the scatter points indicate the C/O ratio. All species pairs in our models which show trends are shown. Reliable tracers are highlighted with thick panel edges.
Current usage metrics show cumulative count of Article Views (full-text article views including HTML views, PDF and ePub downloads, according to the available data) and Abstracts Views on Vision4Press platform.
Data correspond to usage on the plateform after 2015. The current usage metrics is available 48-96 hours after online publication and is updated daily on week days.
Initial download of the metrics may take a while.