Fig. 7
Download original image
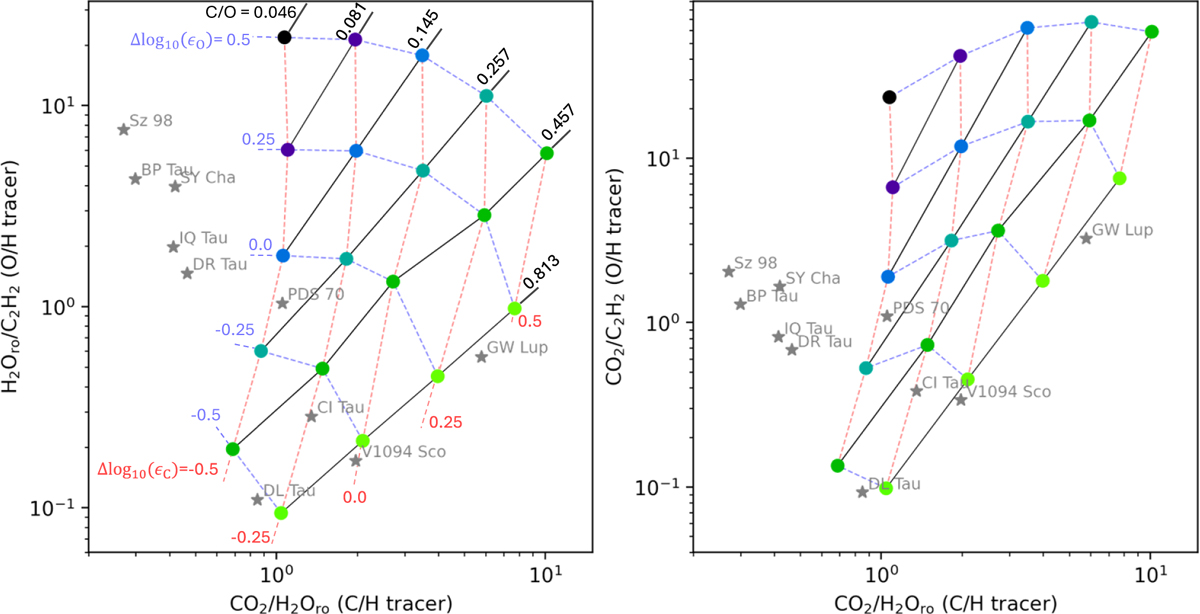
Proposed C/O diagnostics: integrated flux ratios H2O/C2H2 vs. CO2/H2O (left) and CO2/C2H2 vs. CO2/H2O (right). The colors of the scatter points indicate the C/O ratio (see Fig.6). C/O ratio contours are shown as black lines, O/H contours as cyan lines, and C/H contours as red lines. The grey stars indicate the observations. The observed fluxes are taken from Gasman et al. (2025).
Current usage metrics show cumulative count of Article Views (full-text article views including HTML views, PDF and ePub downloads, according to the available data) and Abstracts Views on Vision4Press platform.
Data correspond to usage on the plateform after 2015. The current usage metrics is available 48-96 hours after online publication and is updated daily on week days.
Initial download of the metrics may take a while.