Open Access
Fig. B.1
Download original image
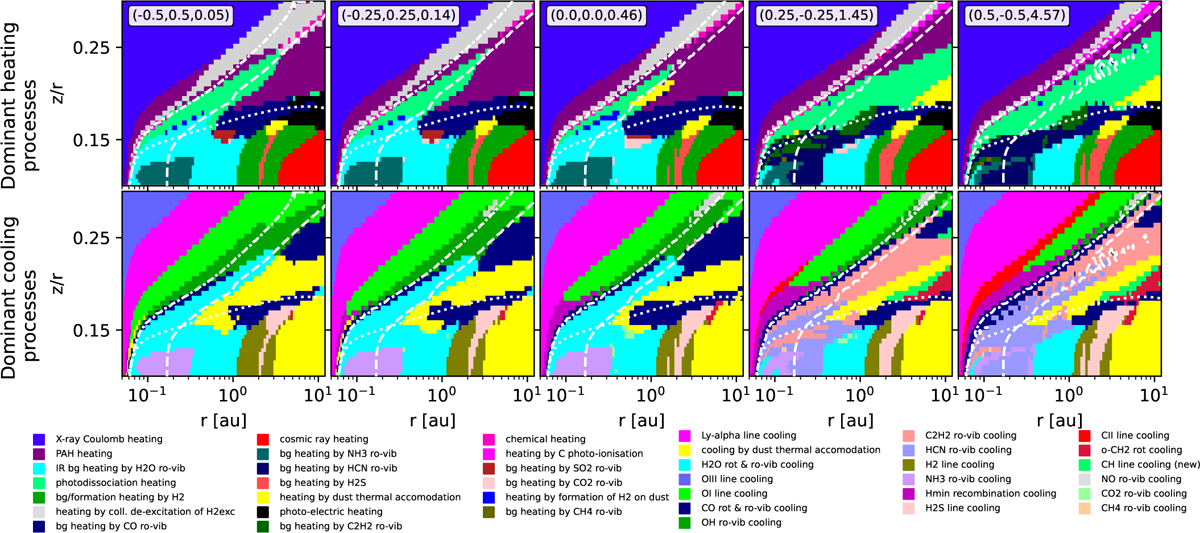
Dominant heating and cooling processes across models of different C/O ratios. The white dashed lines indicate the 300 K and 1000 K gas temperature contours. The white dotted lines indicate the Av=1 line.
Current usage metrics show cumulative count of Article Views (full-text article views including HTML views, PDF and ePub downloads, according to the available data) and Abstracts Views on Vision4Press platform.
Data correspond to usage on the plateform after 2015. The current usage metrics is available 48-96 hours after online publication and is updated daily on week days.
Initial download of the metrics may take a while.