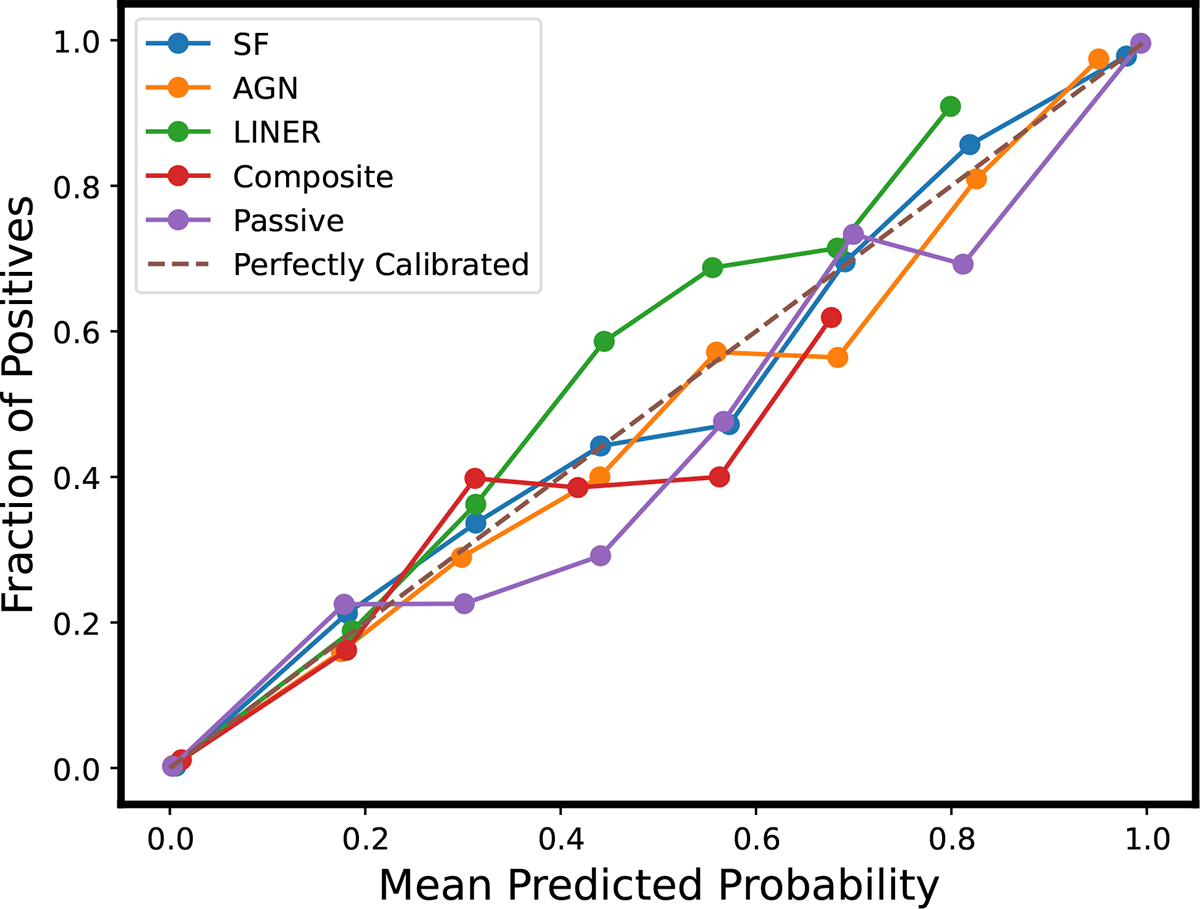
Fig. 2.
Download original image
Calibration curves for the predicted probabilities of each activity class. This plot illustrates the relationship between the predicted probabilities (derived from our diagnostic) and the actual frequency of an activity class appearing among the remaining classes in the feature space. The dashed line represents an idealized classifier with perfect calibration. We observe that for star-forming (SF) and AGN galaxies, the predicted probabilities closely align with the observed frequencies. Passive galaxies exhibit a greater deviation from the dashed line compared to the previous two classes. Notably, LINER galaxies and passive galaxies demonstrate more pronounced deviations, which is consistent with their intricate nature.
Current usage metrics show cumulative count of Article Views (full-text article views including HTML views, PDF and ePub downloads, according to the available data) and Abstracts Views on Vision4Press platform.
Data correspond to usage on the plateform after 2015. The current usage metrics is available 48-96 hours after online publication and is updated daily on week days.
Initial download of the metrics may take a while.