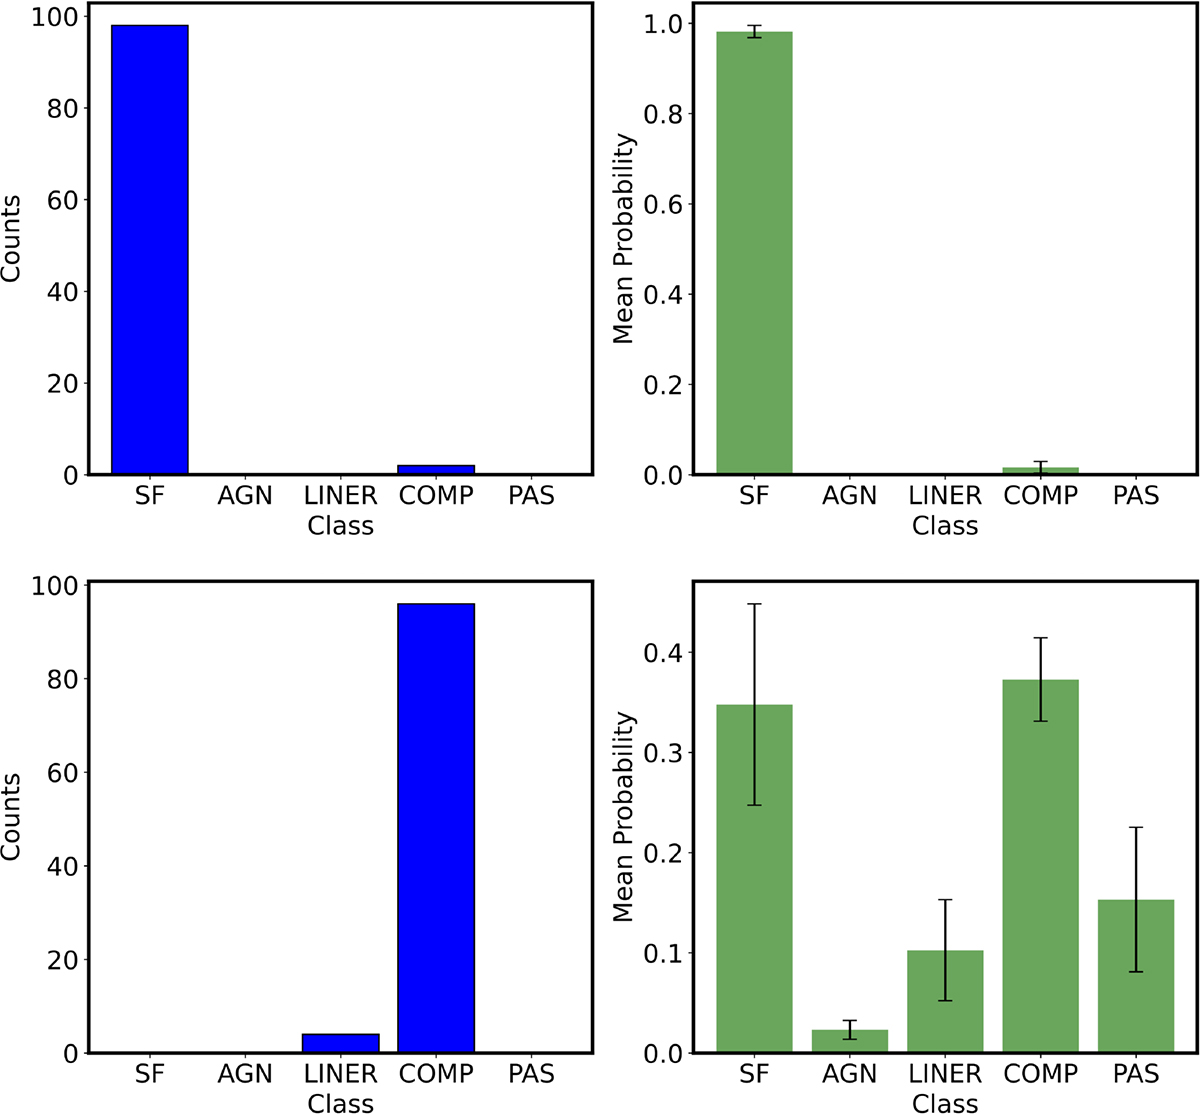
Fig. 4.
Download original image
Two examples of classification output generated by our diagnostic, demonstrating a confident classification (top row) and a less confident classification (bottom row). Both galaxies have the same standard deviation (measurement error) in their EWs across all features. The output left (blue) histograms show the resulting classifications based on Monte Carlo sampling the EW of the spectral features within their uncertainties, while the right (green) histograms show the corresponding probability for the different classes. The error bars represent the standard deviation of the predicted probabilities for each class. The classification result for the galaxy depicted in the top row indicates a reliable classification, whereas the galaxy in the bottom row exhibits ambiguous results.
Current usage metrics show cumulative count of Article Views (full-text article views including HTML views, PDF and ePub downloads, according to the available data) and Abstracts Views on Vision4Press platform.
Data correspond to usage on the plateform after 2015. The current usage metrics is available 48-96 hours after online publication and is updated daily on week days.
Initial download of the metrics may take a while.