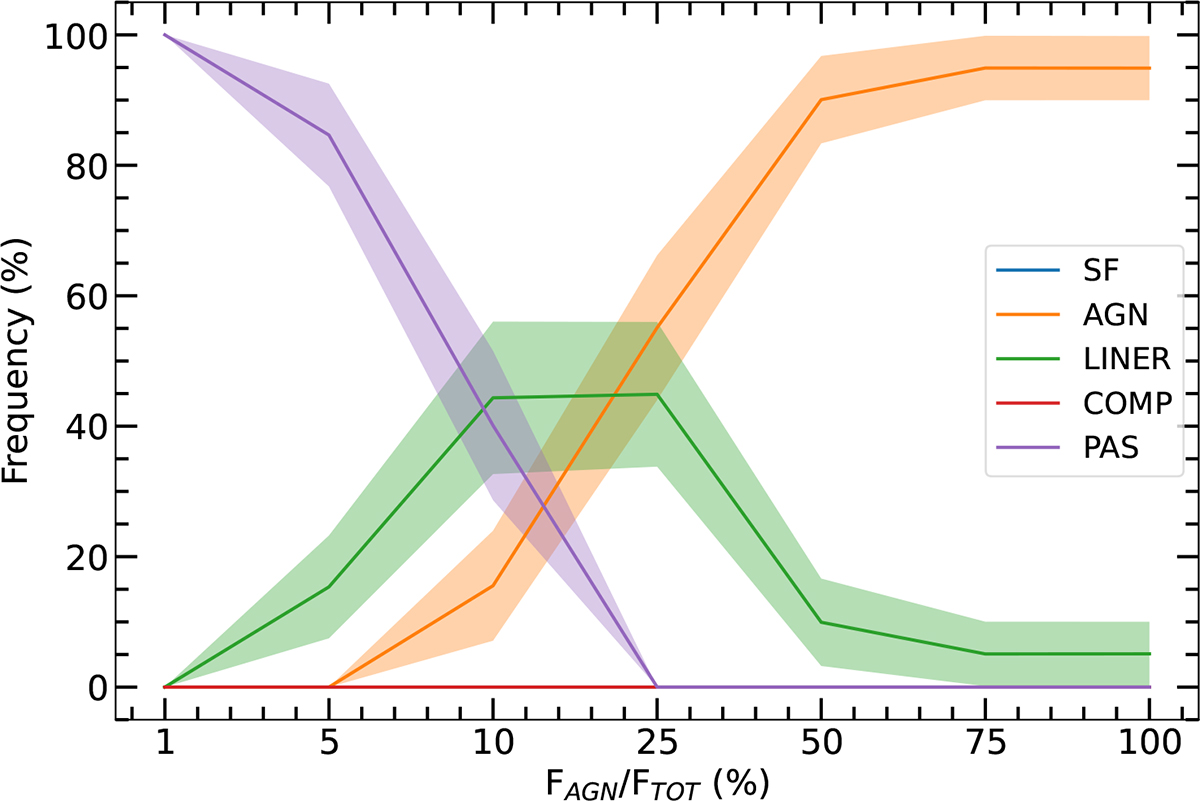
Fig. 6.
Download original image
Classification frequencies of composite spectrum (derived from combining AGN and passive spectra, with respect to the classes considered in our diagnostic scheme) as a function of AGN fractional contribution to the total nuclear (3″) continuum in the SDSS g band. We observe a transition from passive to LINER and then to AGN galaxy classification when the AGN contribution to the nuclear flux in the SDSS g band reaches approximately 10% and 25%, respectively, indicating that our diagnostic is sensitive to AGN contributions in passive galaxies as low as 10% in the g band. The curves depict the average predictions of each class for 20 randomly generated composite spectra, while the shaded areas represent the standard deviation of the classification frequencies.
Current usage metrics show cumulative count of Article Views (full-text article views including HTML views, PDF and ePub downloads, according to the available data) and Abstracts Views on Vision4Press platform.
Data correspond to usage on the plateform after 2015. The current usage metrics is available 48-96 hours after online publication and is updated daily on week days.
Initial download of the metrics may take a while.