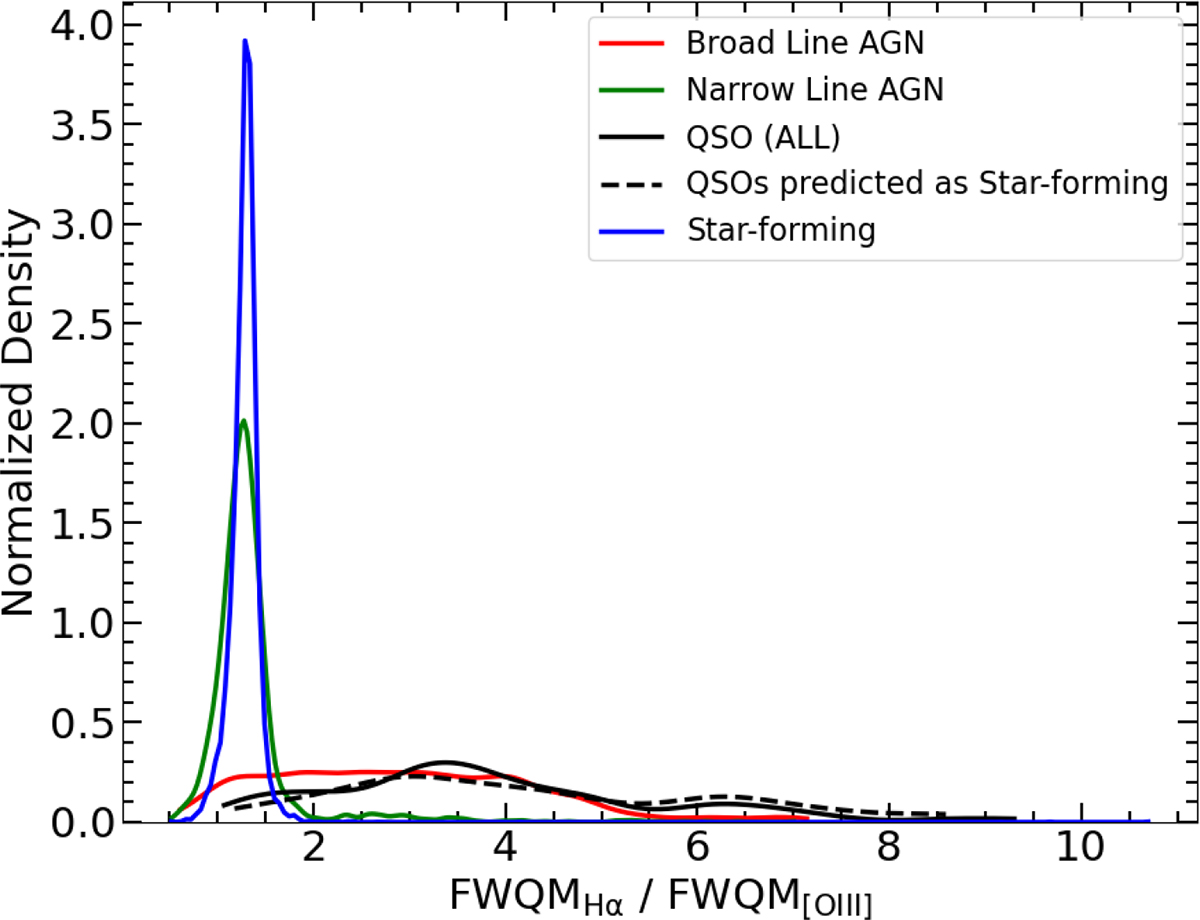
Fig. 8.
Download original image
Histogram of FWQM Hα to [O III] λ5007 Å line ratio for the star-forming, broad-line, and narrow-line AGNs in the training sample (blue, red, and green lines, respectively). We see that the distributions for the narrow-line AGNs and star-forming galaxies are almost identical, while the broad-line AGNs extend to a much larger FWQM ratio, with only a small fraction in the region of the star-forming galaxies or narrow-line AGNs. We also show the very-broad-line galaxies (QSO-like spectra) classified as AGNs (solid black line) and star-forming galaxies (dashed black line). We see that the majority of the QSO-like galaxies classified as star-forming galaxies have much larger FWQM ratios than bona fide star-forming galaxies, allowing us to use the FWQM ratio as a metric to correctly classify them.
Current usage metrics show cumulative count of Article Views (full-text article views including HTML views, PDF and ePub downloads, according to the available data) and Abstracts Views on Vision4Press platform.
Data correspond to usage on the plateform after 2015. The current usage metrics is available 48-96 hours after online publication and is updated daily on week days.
Initial download of the metrics may take a while.