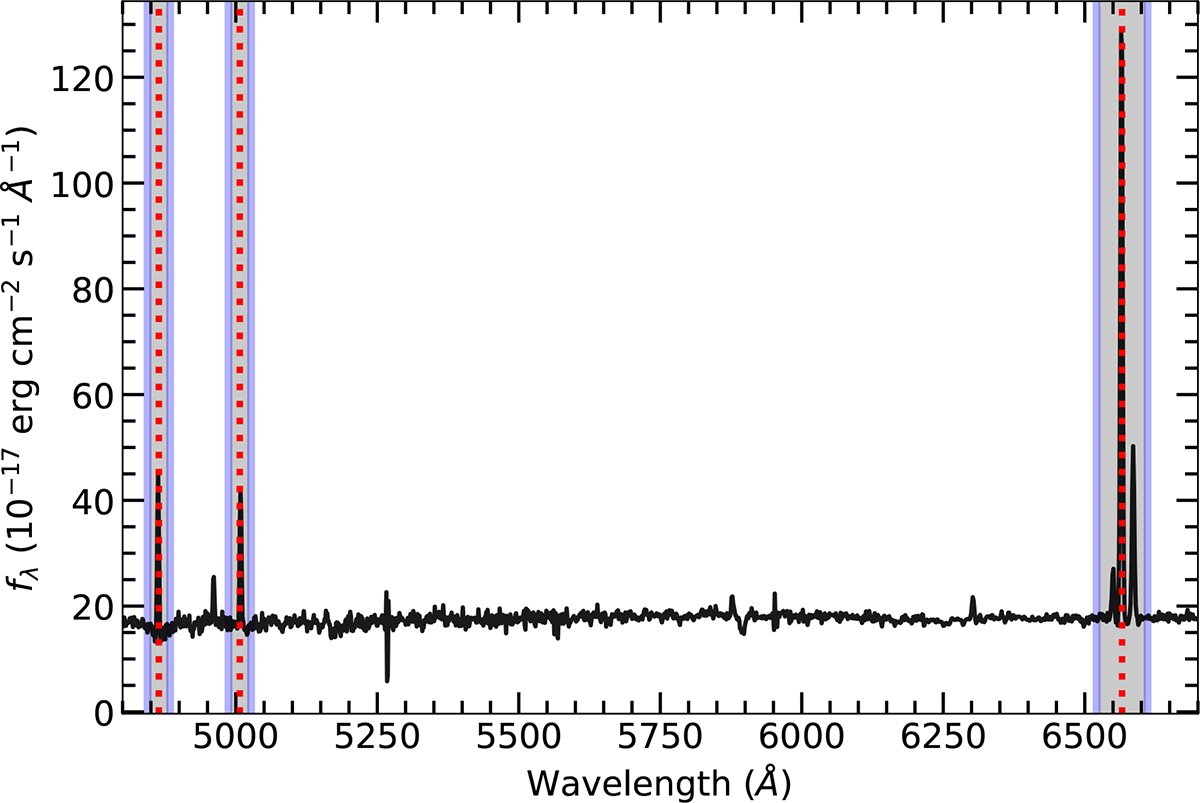
Fig. B.1.
Download original image
Examples of spectra used to assess the impact of erroneous flux calibration. The orange spectrum indicates the original spectrum, while the blue spectra show the same spectrum convolved with a fifth order polynomial (top) and a sine function (bottom). Notably, both convolved spectra were accurately classified by our diagnostic, yielding the same classification as when utilizing the original SDSS spectra.
Current usage metrics show cumulative count of Article Views (full-text article views including HTML views, PDF and ePub downloads, according to the available data) and Abstracts Views on Vision4Press platform.
Data correspond to usage on the plateform after 2015. The current usage metrics is available 48-96 hours after online publication and is updated daily on week days.
Initial download of the metrics may take a while.