Fig. 1.
Download original image
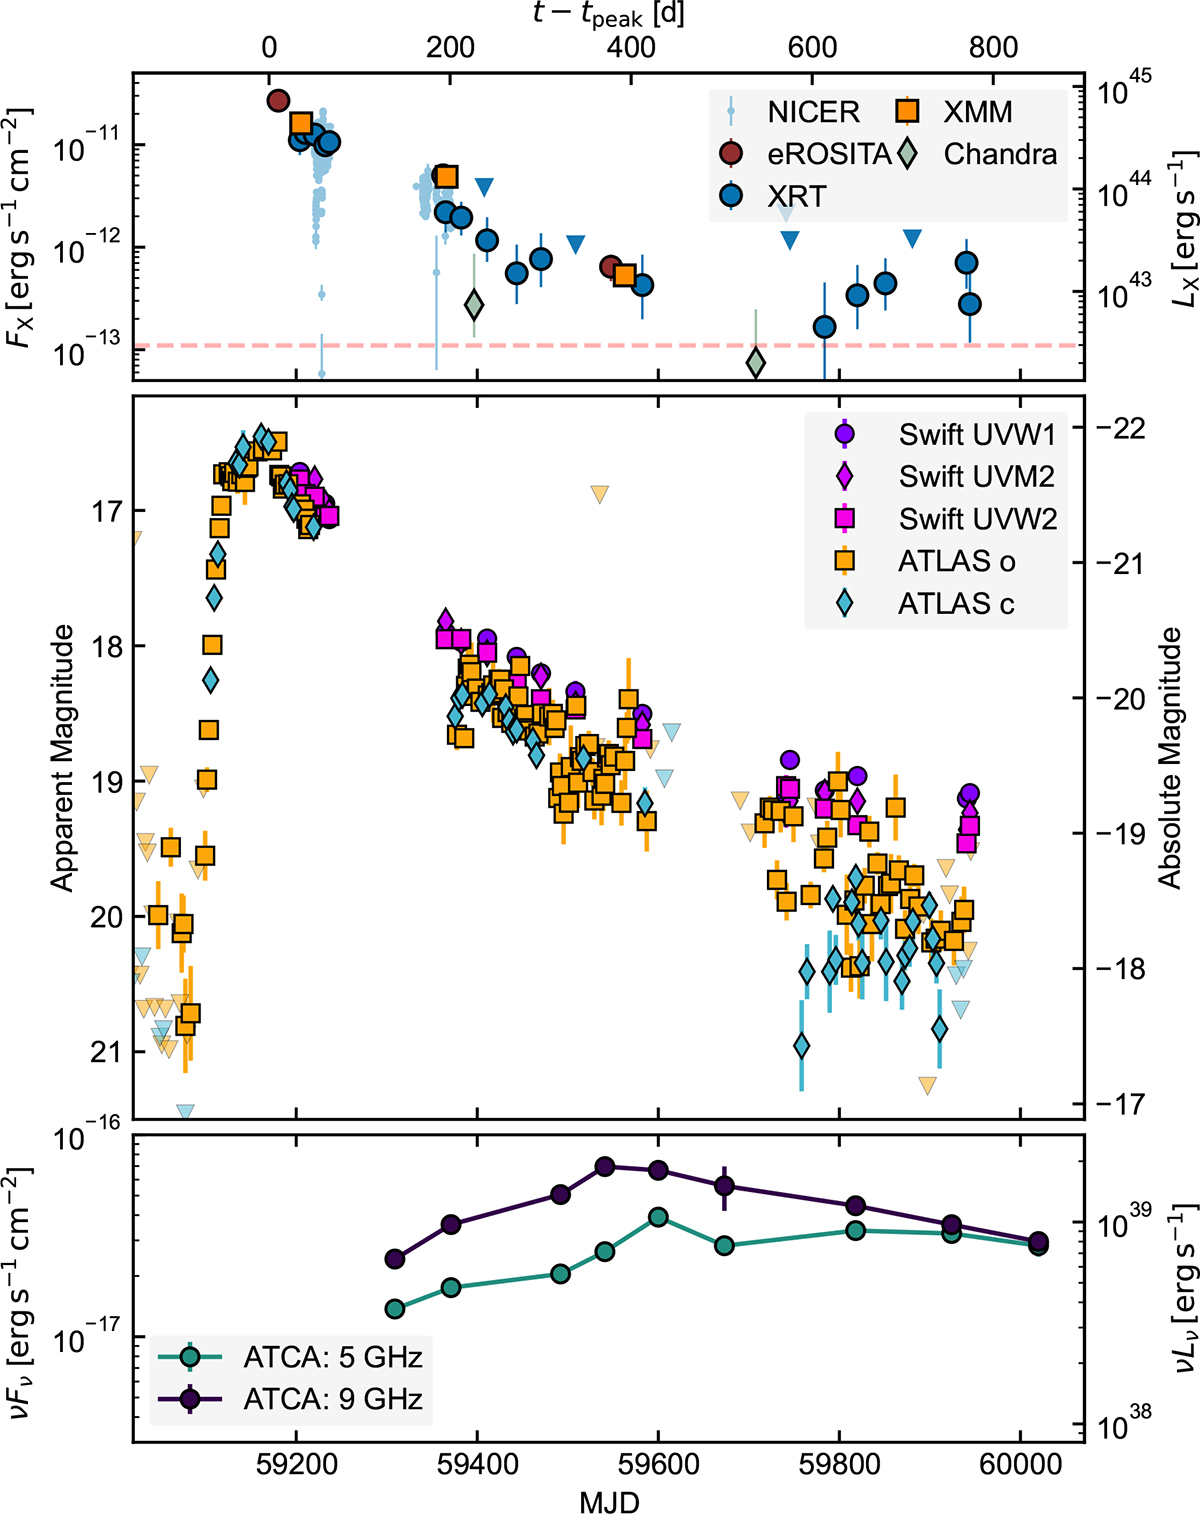
Multi-wavelength light curve evolution of J2344, with the unabsorbed 0.2−2 keV fluxes (top panel) and the optical and UV fluxes (middle). Triangular data points denote 3σ upper limits on the flux. The horizontal dashed red line in the X-ray light curve panel denotes the 3σ upper limit on the 0.2−2 keV flux inferred from the non-detection of J2344 in eRASS1 (Homan et al. 2023), approximately 200 days before optical peak. The radio evolution (bottom panel) is well described by an expanding synchrotron-emitting region from a single ejection of material, consistent with an outflow launched by a non-relativistic TDE (Goodwin et al. 2024).
Current usage metrics show cumulative count of Article Views (full-text article views including HTML views, PDF and ePub downloads, according to the available data) and Abstracts Views on Vision4Press platform.
Data correspond to usage on the plateform after 2015. The current usage metrics is available 48-96 hours after online publication and is updated daily on week days.
Initial download of the metrics may take a while.