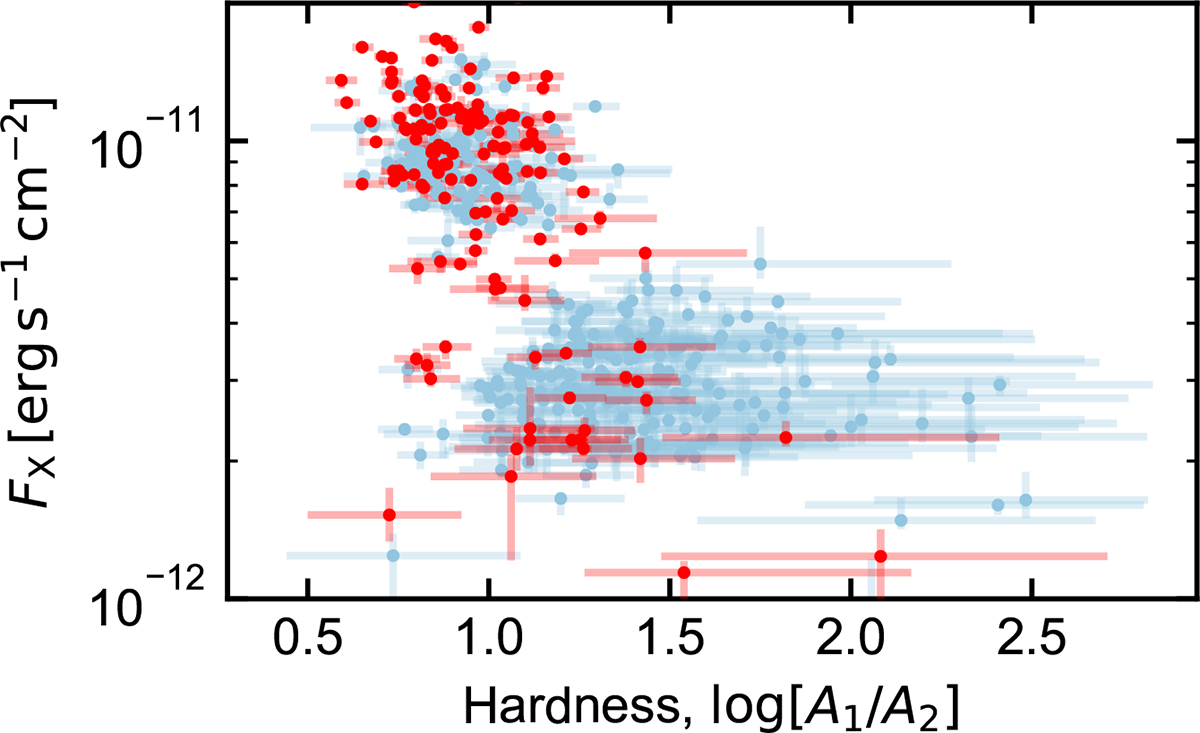
Fig. D.1.
Download original image
0.2−2 keV observed flux, FX against an estimate of the spectral hardness (log[A1/A2]) during the early time NICER observations presented in Fig. 4. When FX is higher, the spectrum becomes harder. The red markers denote observations obtained when the source exhibited large amplitude modulations during W1. A smaller log[A1/A2] value denotes a harder X-ray spectrum.
Current usage metrics show cumulative count of Article Views (full-text article views including HTML views, PDF and ePub downloads, according to the available data) and Abstracts Views on Vision4Press platform.
Data correspond to usage on the plateform after 2015. The current usage metrics is available 48-96 hours after online publication and is updated daily on week days.
Initial download of the metrics may take a while.