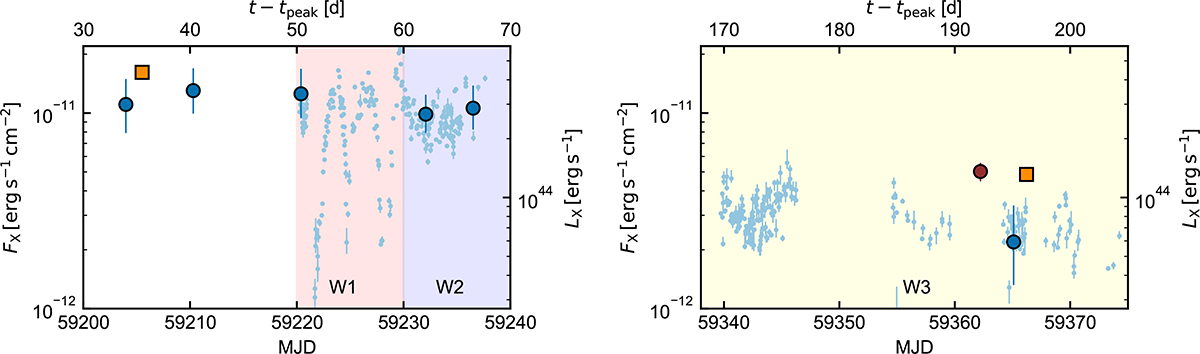
Fig. 2.
Download original image
Zoomed-in view of the X-ray evolution during the high-cadence NICER observations. The two panels have the same y-axis and cover the same amount of time on the x-axis. The different shaded backgrounds denote windows W1, W2, and W3 for the NICER observations (Sect. 3.1.3), taken 50−60 days, 60−70 days, and 165−210 days after optical peak.
Current usage metrics show cumulative count of Article Views (full-text article views including HTML views, PDF and ePub downloads, according to the available data) and Abstracts Views on Vision4Press platform.
Data correspond to usage on the plateform after 2015. The current usage metrics is available 48-96 hours after online publication and is updated daily on week days.
Initial download of the metrics may take a while.