Fig. 3.
Download original image
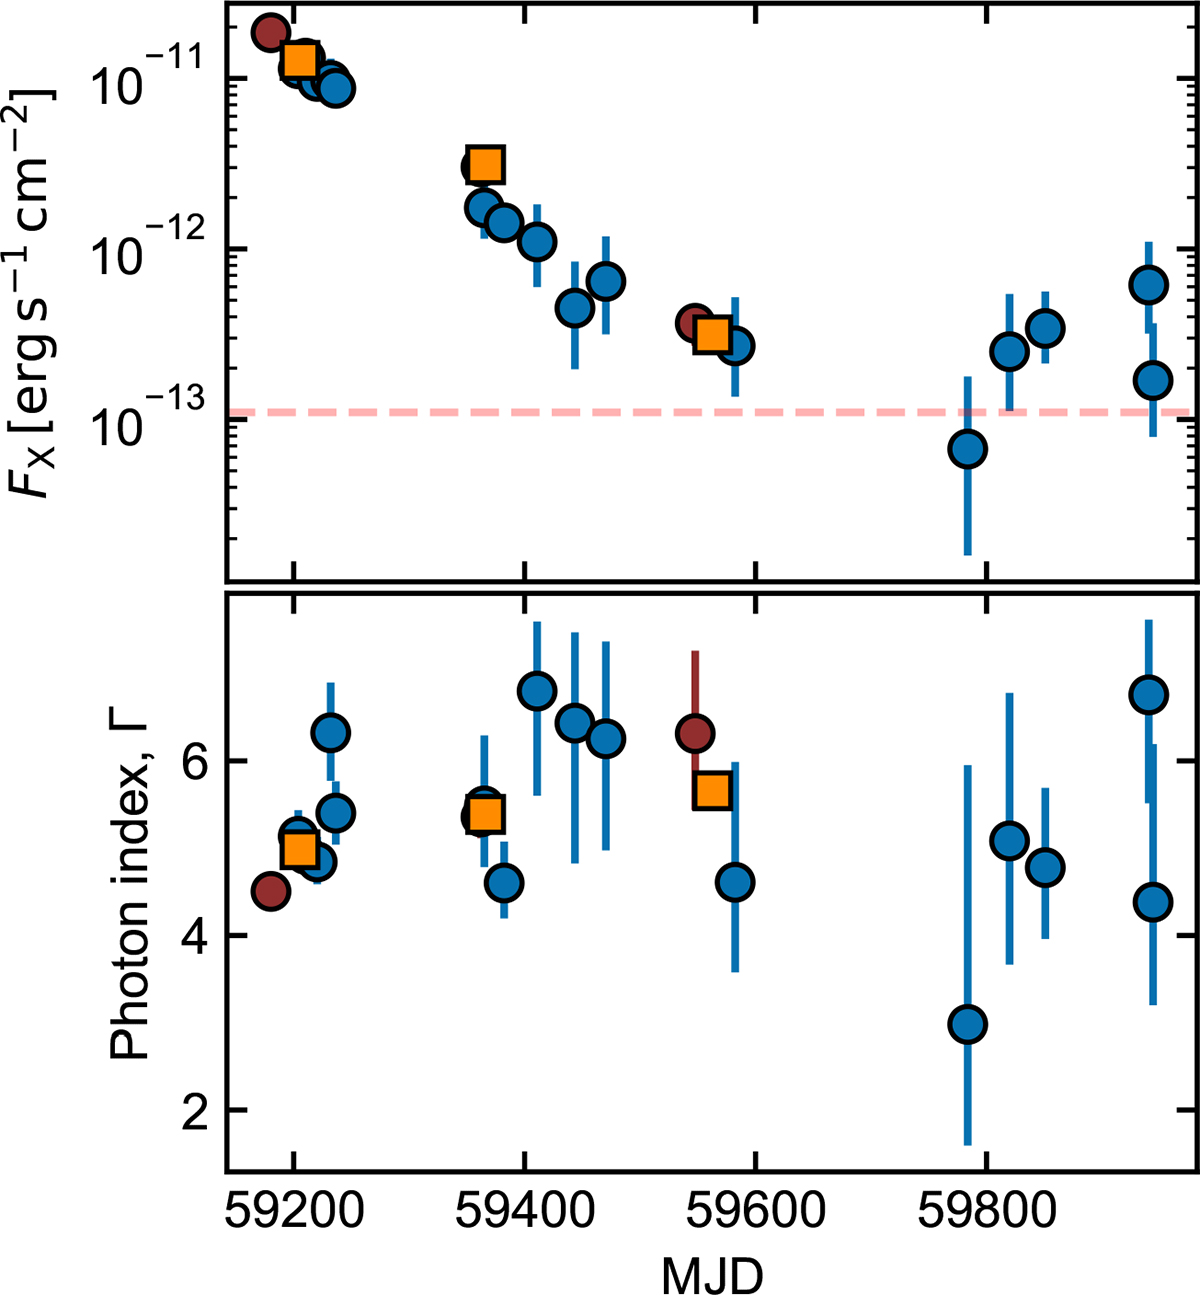
Joint evolution of the observed 0.2−2 keV flux (top panel) and the photon index (bottom panel) over time. The dashed red line marks the 3σ flux upper limit inferred from the non-detection in eRASS1. The X-ray spectrum remains ultra-soft (Γ ≳ 4) over the ∼760 days of X-ray monitoring (∼800 days after optical peak; Homan et al. 2023).
Current usage metrics show cumulative count of Article Views (full-text article views including HTML views, PDF and ePub downloads, according to the available data) and Abstracts Views on Vision4Press platform.
Data correspond to usage on the plateform after 2015. The current usage metrics is available 48-96 hours after online publication and is updated daily on week days.
Initial download of the metrics may take a while.