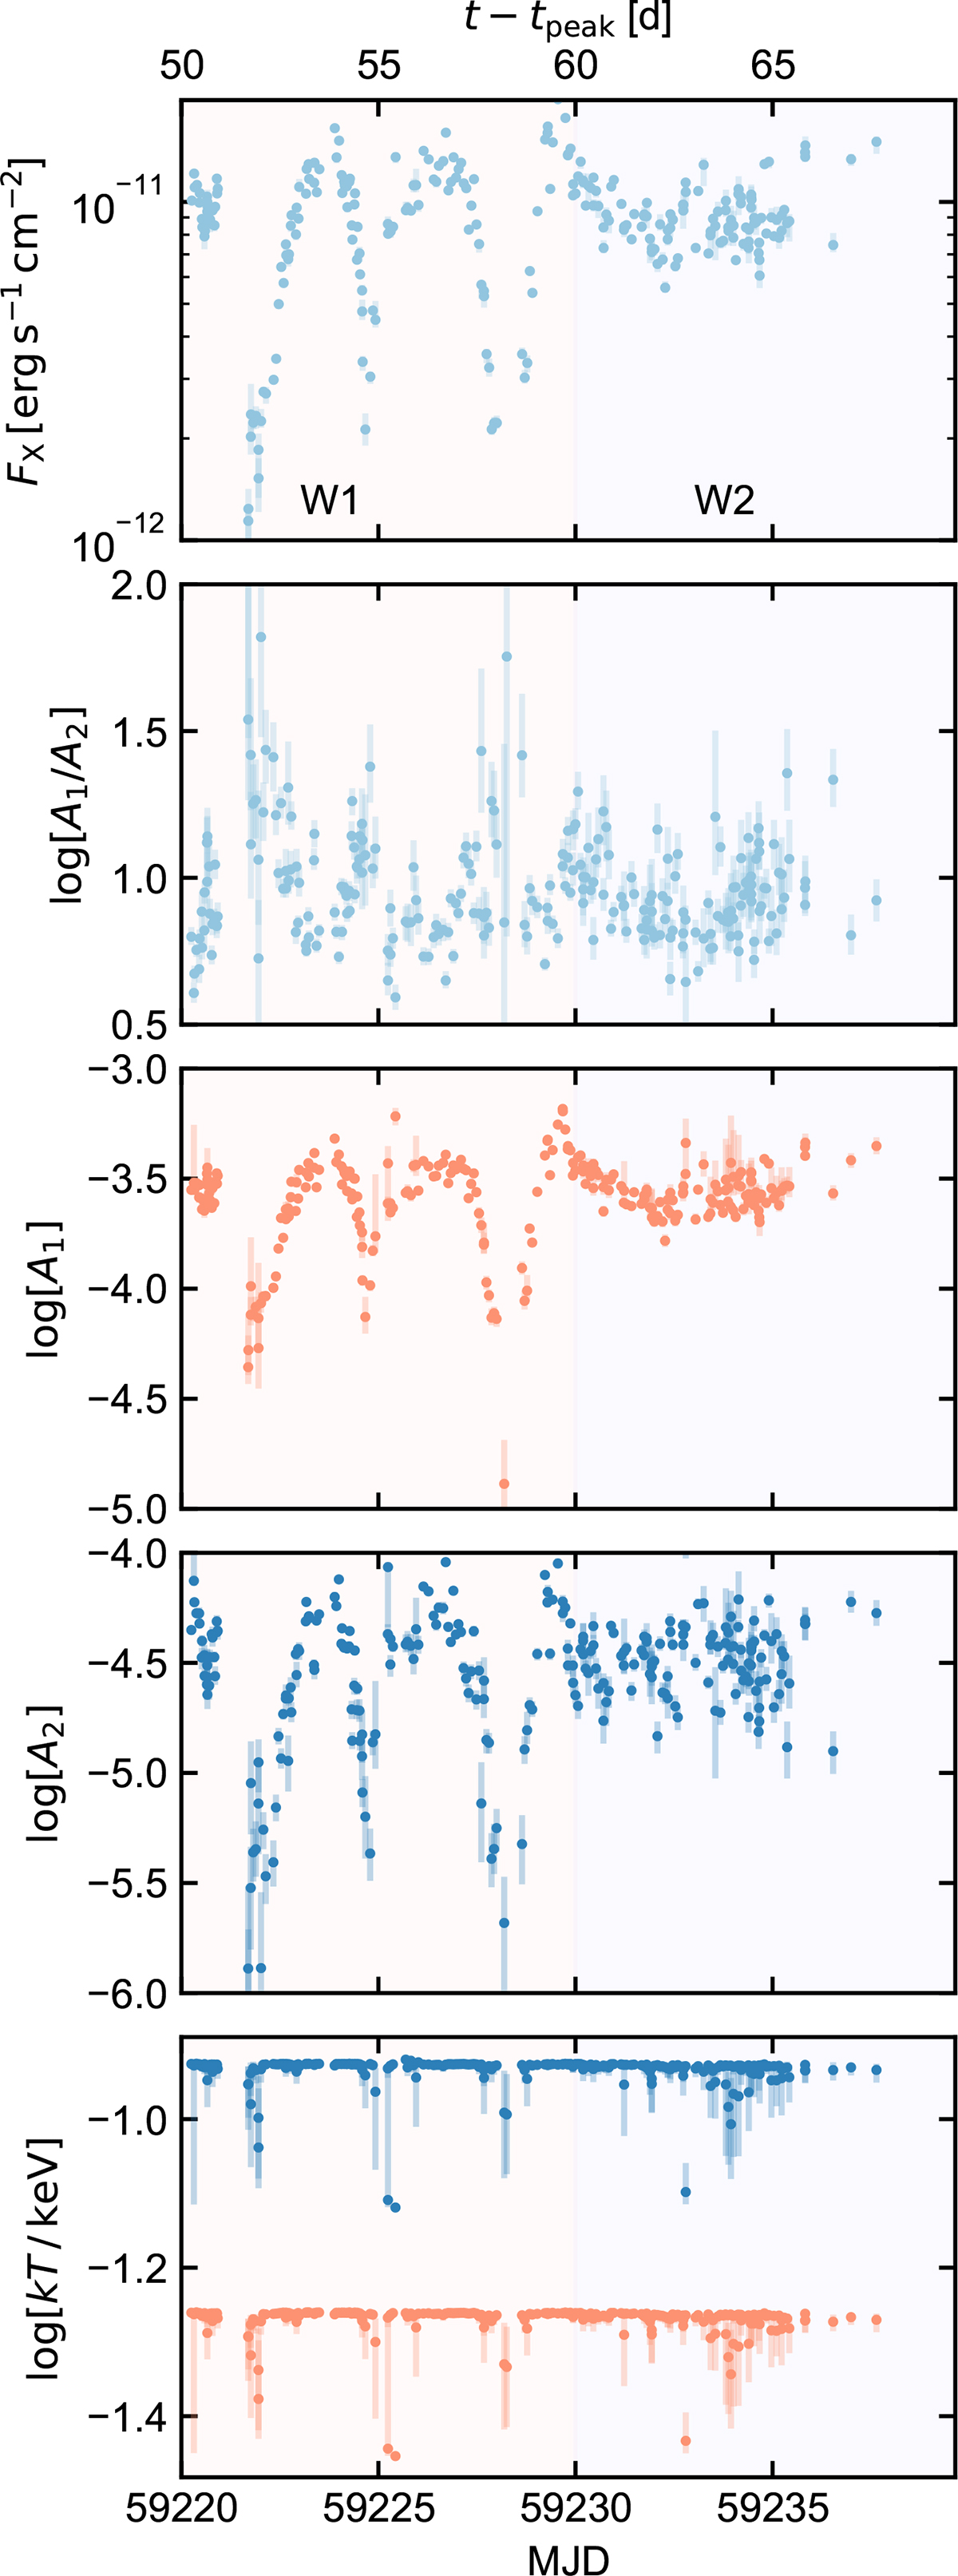
Fig. 4.
Download original image
Top panel: Evolution of the 0.2−2 keV flux, FX, over time during the high-cadence NICER observations at early times (∼50 days after optical peak). Second panel: spectral hardness estimated as log[A1/A2], with A1 and A2 the normalisation of the softer and harder blackbody components, respectively. Since smaller log[A1/A2] values correspond to harder spectra, J2344 exhibits a harder-when-brighter behaviour. Third and fourth panels: log A1 and log A2 in units of L39/[D10(1 + z)]2, with L39 the luminosity in 1039 erg s−1 and D10 the distance to the source in units of 10 kpc. Bottom panel: Evolution of the blackbody temperatures for each model component. The kT1 (orange) and kT2 (blue) were constrained to the 35−55 eV and 100−140 eV ranges during fitting.
Current usage metrics show cumulative count of Article Views (full-text article views including HTML views, PDF and ePub downloads, according to the available data) and Abstracts Views on Vision4Press platform.
Data correspond to usage on the plateform after 2015. The current usage metrics is available 48-96 hours after online publication and is updated daily on week days.
Initial download of the metrics may take a while.