Fig. 8.
Download original image
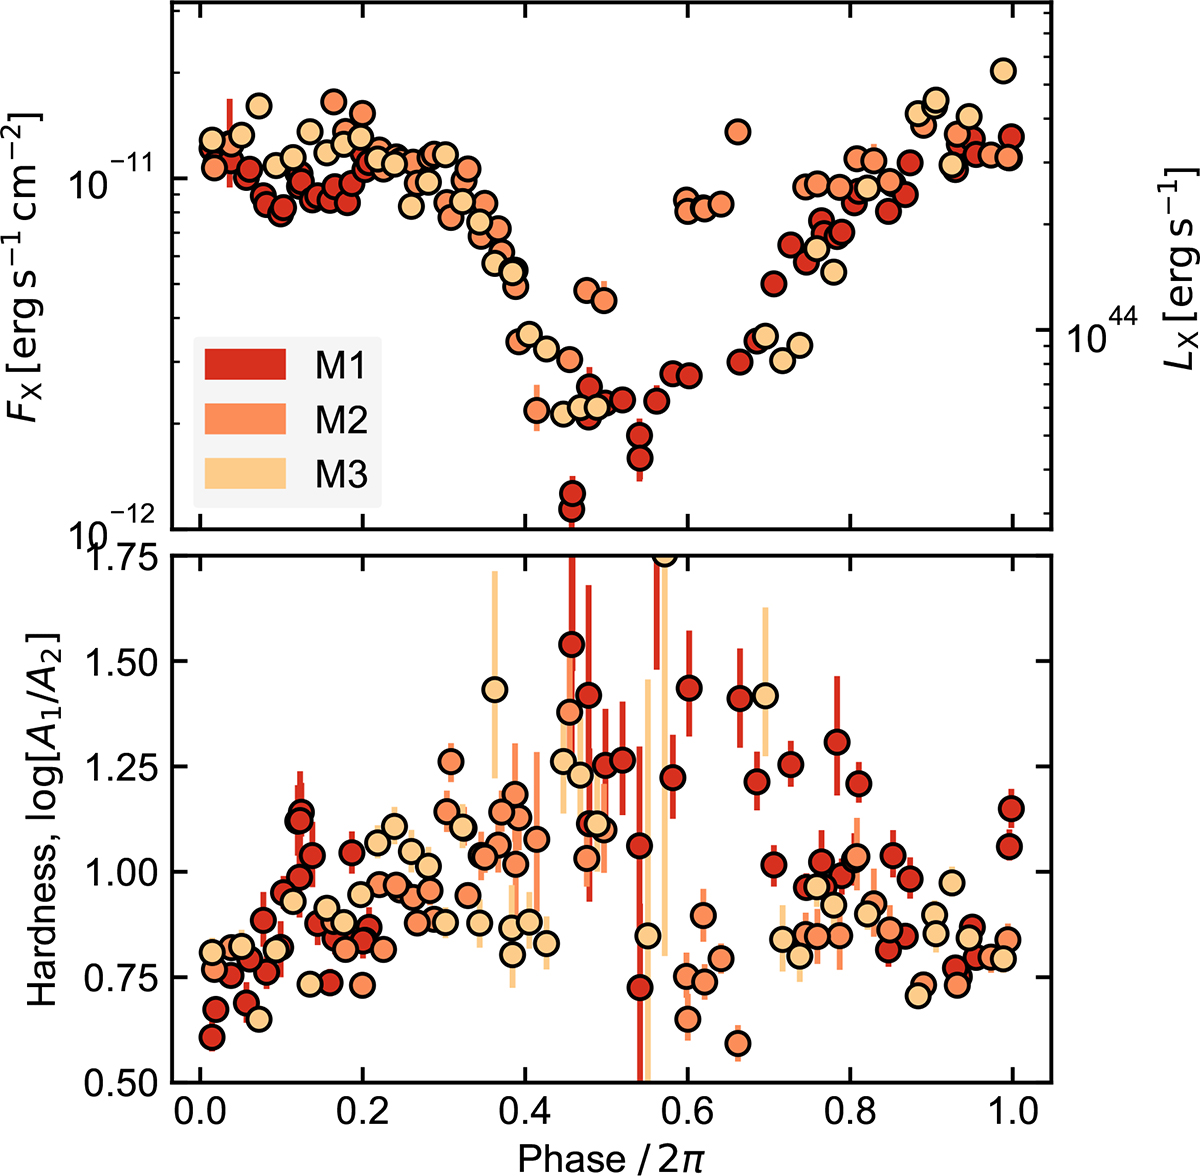
Folded 0.2−2 keV flux light curve (top panel) and hardness (bottom panel) of the NICER data from W1. In each modulation, the X-ray spectrum softens (higher log[A1/A2]) when the flux drops. The data points are coloured based upon which modulation they are associated with – M1, M2, or M3 – with M1 starting at MJD = 59220.3, and the light curves are folded with a periodicity of 3.05 days (this is consistent with the periodicity estimate of ![]() days provided by the LSP, but folding at 3.05 days provides a clearer presentation of each modulation than 3.0 days).
days provided by the LSP, but folding at 3.05 days provides a clearer presentation of each modulation than 3.0 days).
Current usage metrics show cumulative count of Article Views (full-text article views including HTML views, PDF and ePub downloads, according to the available data) and Abstracts Views on Vision4Press platform.
Data correspond to usage on the plateform after 2015. The current usage metrics is available 48-96 hours after online publication and is updated daily on week days.
Initial download of the metrics may take a while.