Open Access
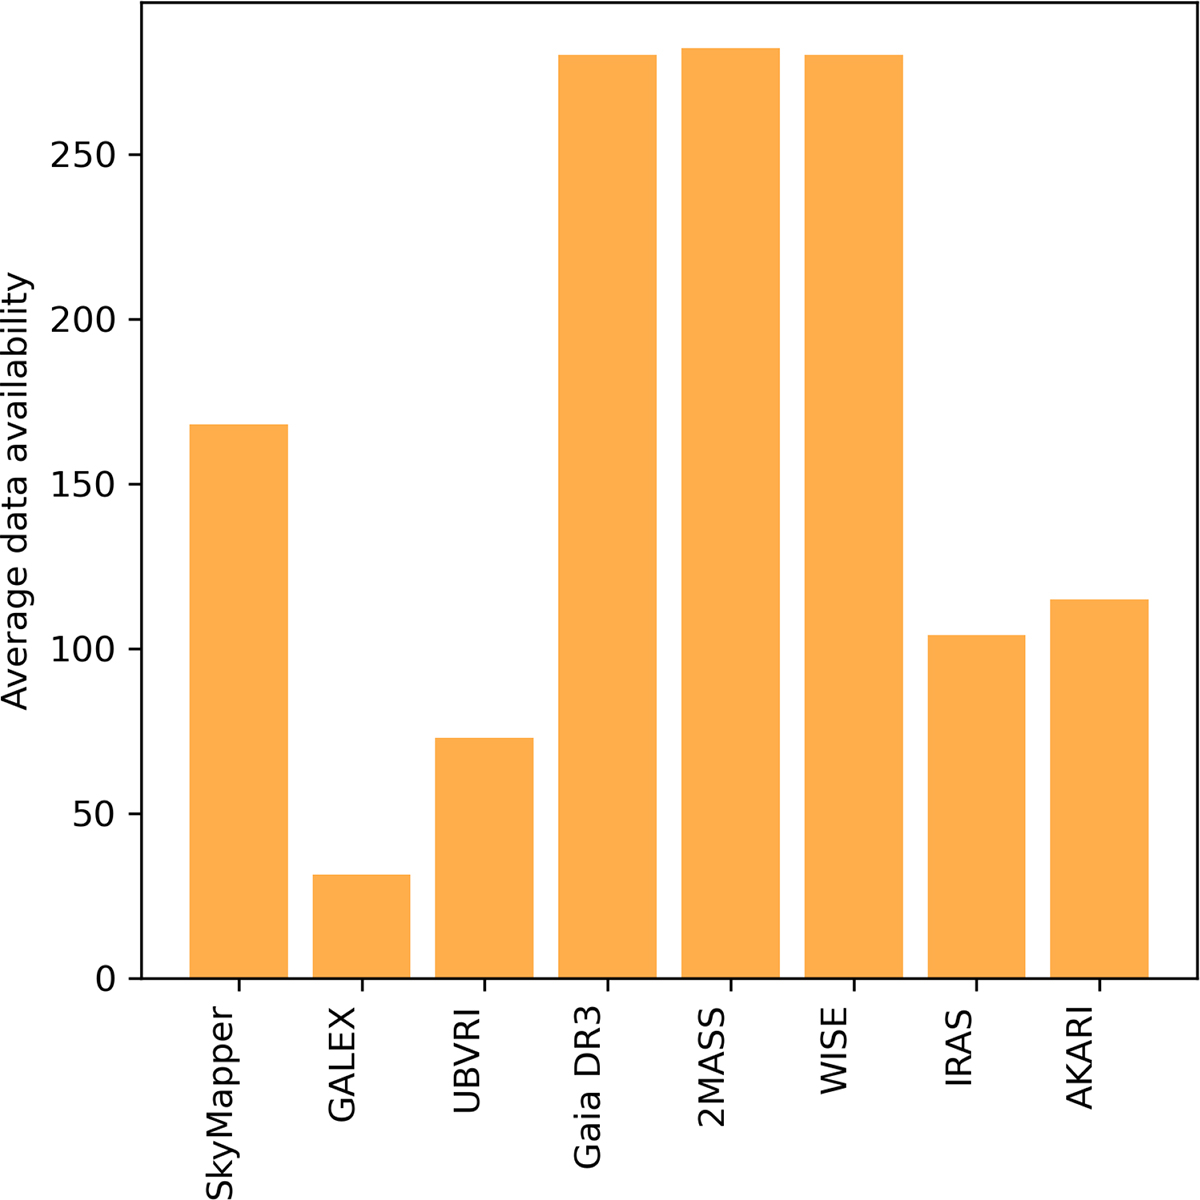
Fig. 1.
Download original image
Average number of valid measurements per photometric group in the sample. Each bar represents the mean number of available (not missing) values for the bands belonging to a given instrument or spectral range.
Current usage metrics show cumulative count of Article Views (full-text article views including HTML views, PDF and ePub downloads, according to the available data) and Abstracts Views on Vision4Press platform.
Data correspond to usage on the plateform after 2015. The current usage metrics is available 48-96 hours after online publication and is updated daily on week days.
Initial download of the metrics may take a while.