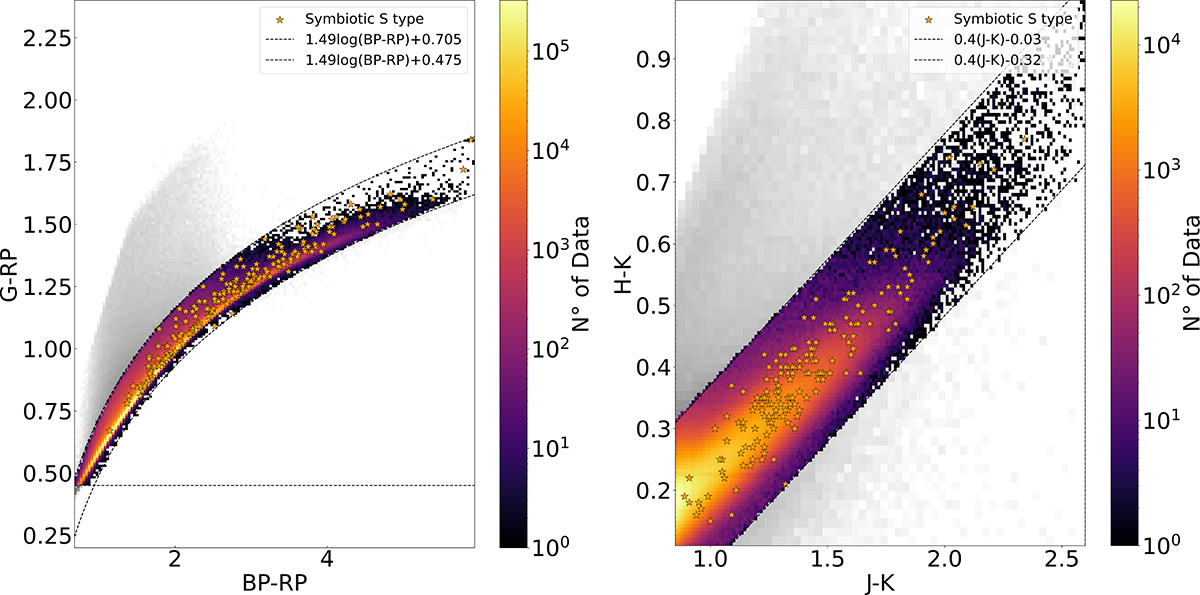
Fig. 2.
Download original image
Color–color selection process. Left: 2D histogram of approximately 17 988 392 sources obtained from four ADQL queries to the Gaia services and a WISE cross-match. The first selection cut was applied in the Gaia color–color diagram using a linear regression in logarithmic scale, resulting in the removal of 143 434 sources. Confirmed SySts are marked as orange stars. Right: 2D histogram of over 4 million sources selected from the 2MASS color–color diagram. The color bar indicates the number of sources per bin in logarithmic scale for both panels.
Current usage metrics show cumulative count of Article Views (full-text article views including HTML views, PDF and ePub downloads, according to the available data) and Abstracts Views on Vision4Press platform.
Data correspond to usage on the plateform after 2015. The current usage metrics is available 48-96 hours after online publication and is updated daily on week days.
Initial download of the metrics may take a while.