Fig. B.1.
Download original image
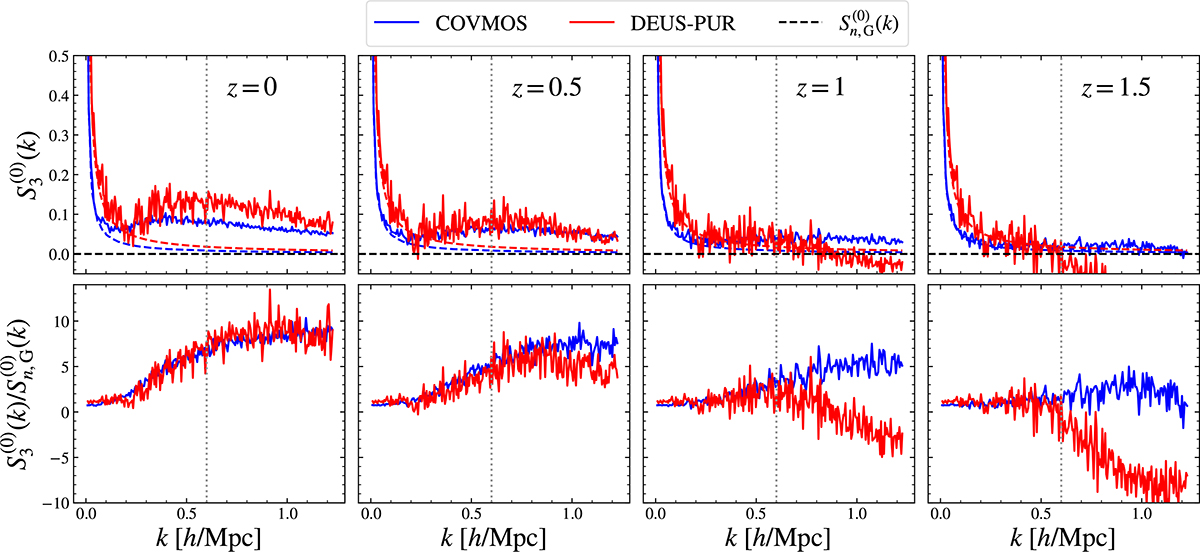
Comparison between COVMOS and DEUS-PUR. Top: Skewness of the distribution of the monopole of the real-space matter power spectrum (COVMOS and DEUS-PUR) in solid blue and red lines. The dashed line represents the corresponding predictions in the case of a Gaussian density field, computed using Eq. (26). Bottom: Ratio of the estimated skewness to the Gaussian field prediction, following the same colour code.
Current usage metrics show cumulative count of Article Views (full-text article views including HTML views, PDF and ePub downloads, according to the available data) and Abstracts Views on Vision4Press platform.
Data correspond to usage on the plateform after 2015. The current usage metrics is available 48-96 hours after online publication and is updated daily on week days.
Initial download of the metrics may take a while.