Open Access
Fig. 4.
Download original image
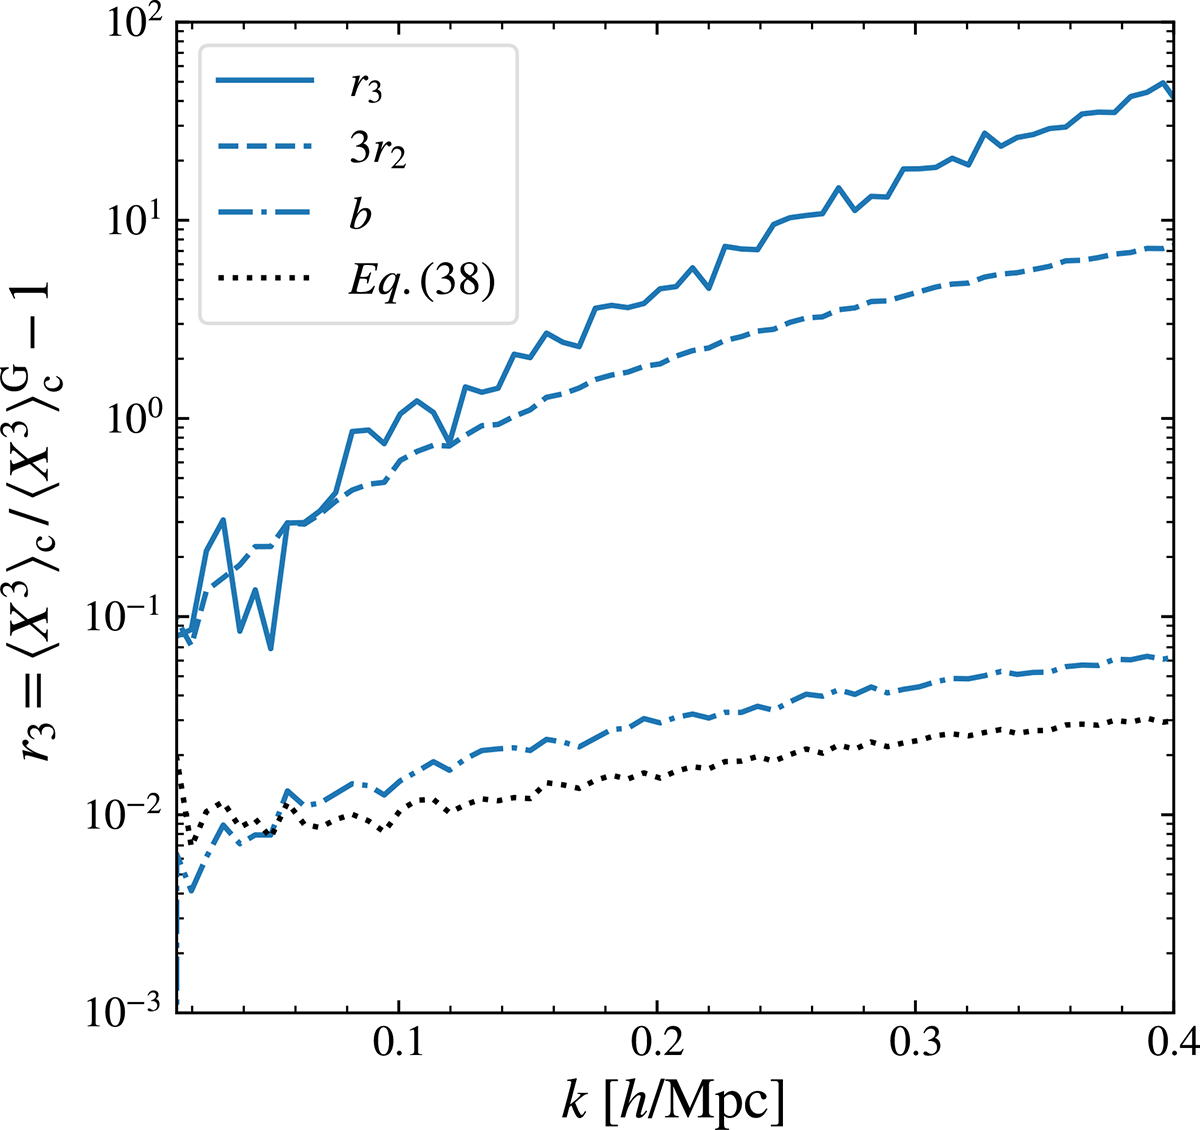
Measurement of r3 from the ΛCDM simulation at z = 0 and its different contributions. The solid line shows the total relative difference r3, while the dashed and dot-dashed lines show the trispectrum and bispectrum contribution, 3r2 and b, respectively. The dotted black line shows a rough estimation of b based on Eq. (39).
Current usage metrics show cumulative count of Article Views (full-text article views including HTML views, PDF and ePub downloads, according to the available data) and Abstracts Views on Vision4Press platform.
Data correspond to usage on the plateform after 2015. The current usage metrics is available 48-96 hours after online publication and is updated daily on week days.
Initial download of the metrics may take a while.