Fig. 5.
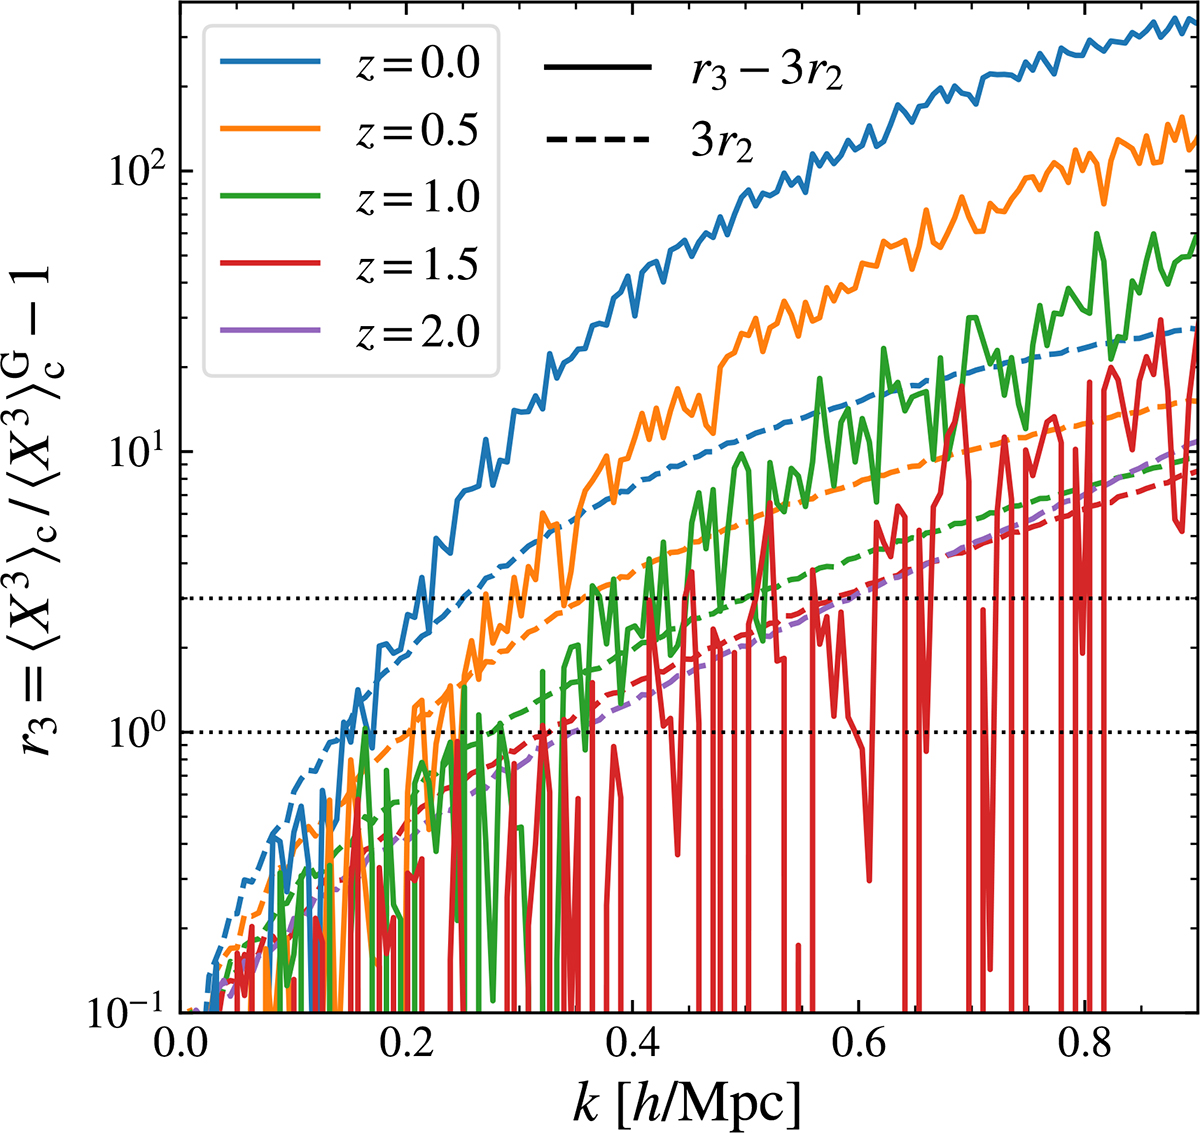
Download original image
Relative excess skewness, r3, made of two contributions: 3r2 and r3 − 3r2 (respectively in dashed and solid lines). The colours correspond to the different redshifts. For clarity of the figure, we do not show r3 − 3r2 for z = 2, as it is compatible with 0. There are two horizontal dotted black lines showing the levels 1 and 3.
Current usage metrics show cumulative count of Article Views (full-text article views including HTML views, PDF and ePub downloads, according to the available data) and Abstracts Views on Vision4Press platform.
Data correspond to usage on the plateform after 2015. The current usage metrics is available 48-96 hours after online publication and is updated daily on week days.
Initial download of the metrics may take a while.