Open Access
Fig. 9.
Download original image
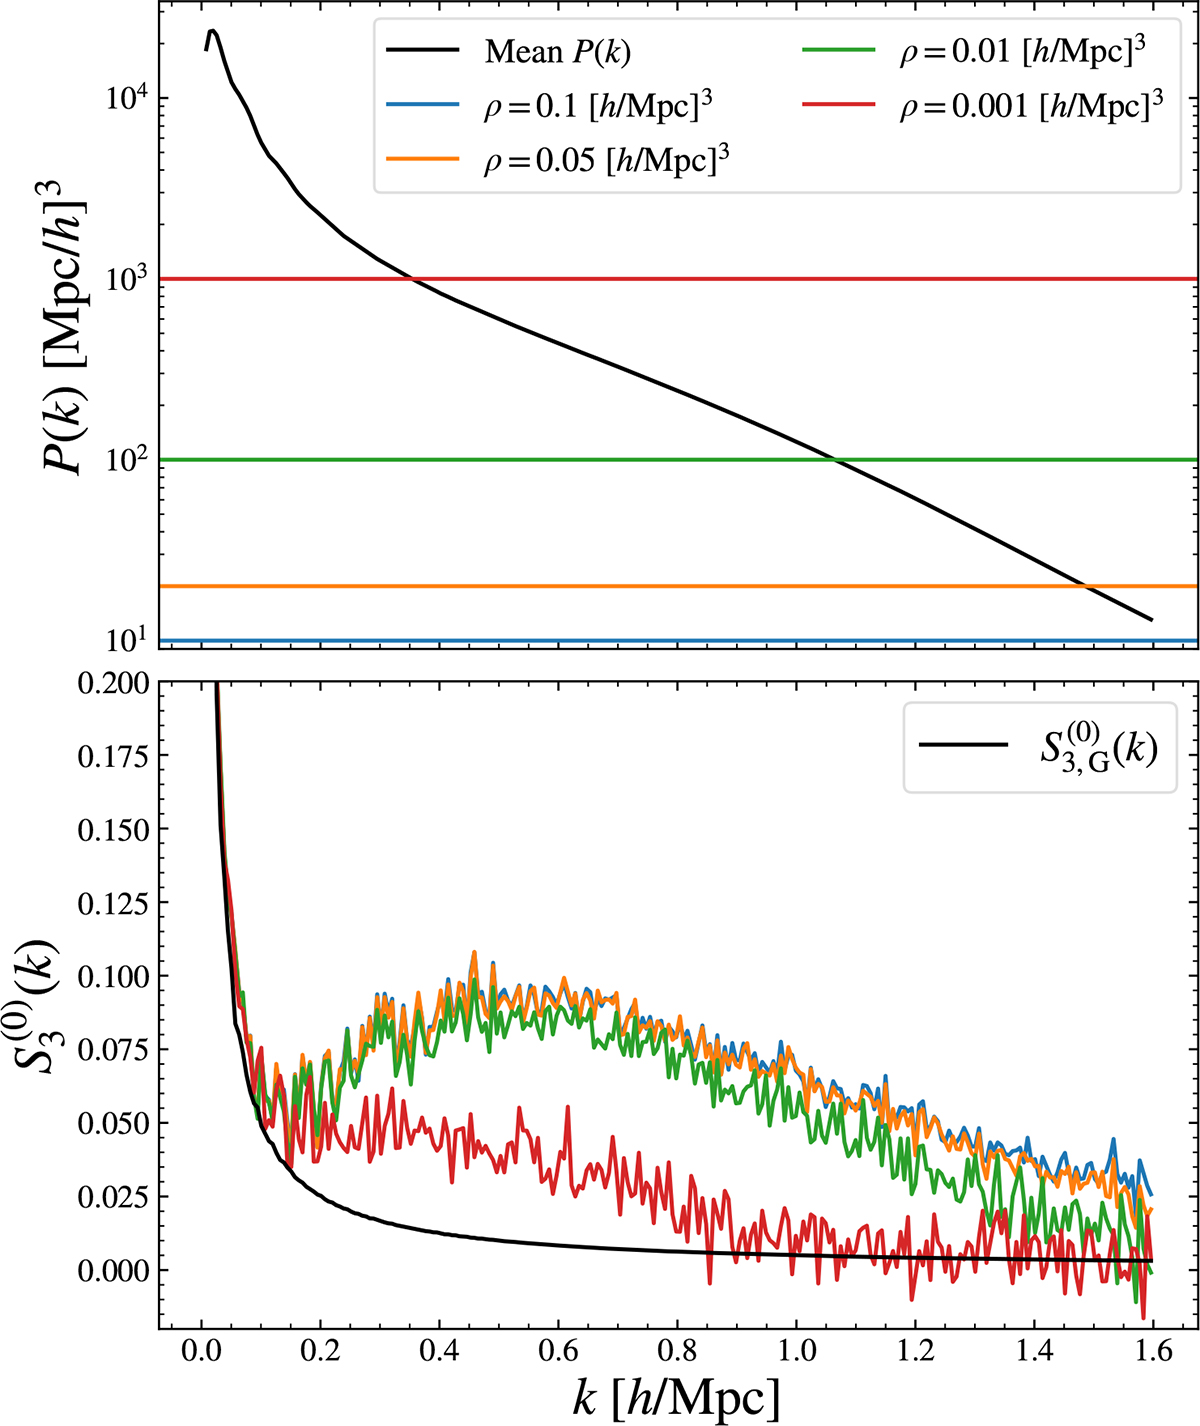
Impact of the shot noise. Top: Mean power spectrum for the reference sample and the different level of shot noise corresponding to each density. Bottom: Estimated skewness for the different densities considered (coloured lines) and the Gaussian field prediction (black line).
Current usage metrics show cumulative count of Article Views (full-text article views including HTML views, PDF and ePub downloads, according to the available data) and Abstracts Views on Vision4Press platform.
Data correspond to usage on the plateform after 2015. The current usage metrics is available 48-96 hours after online publication and is updated daily on week days.
Initial download of the metrics may take a while.