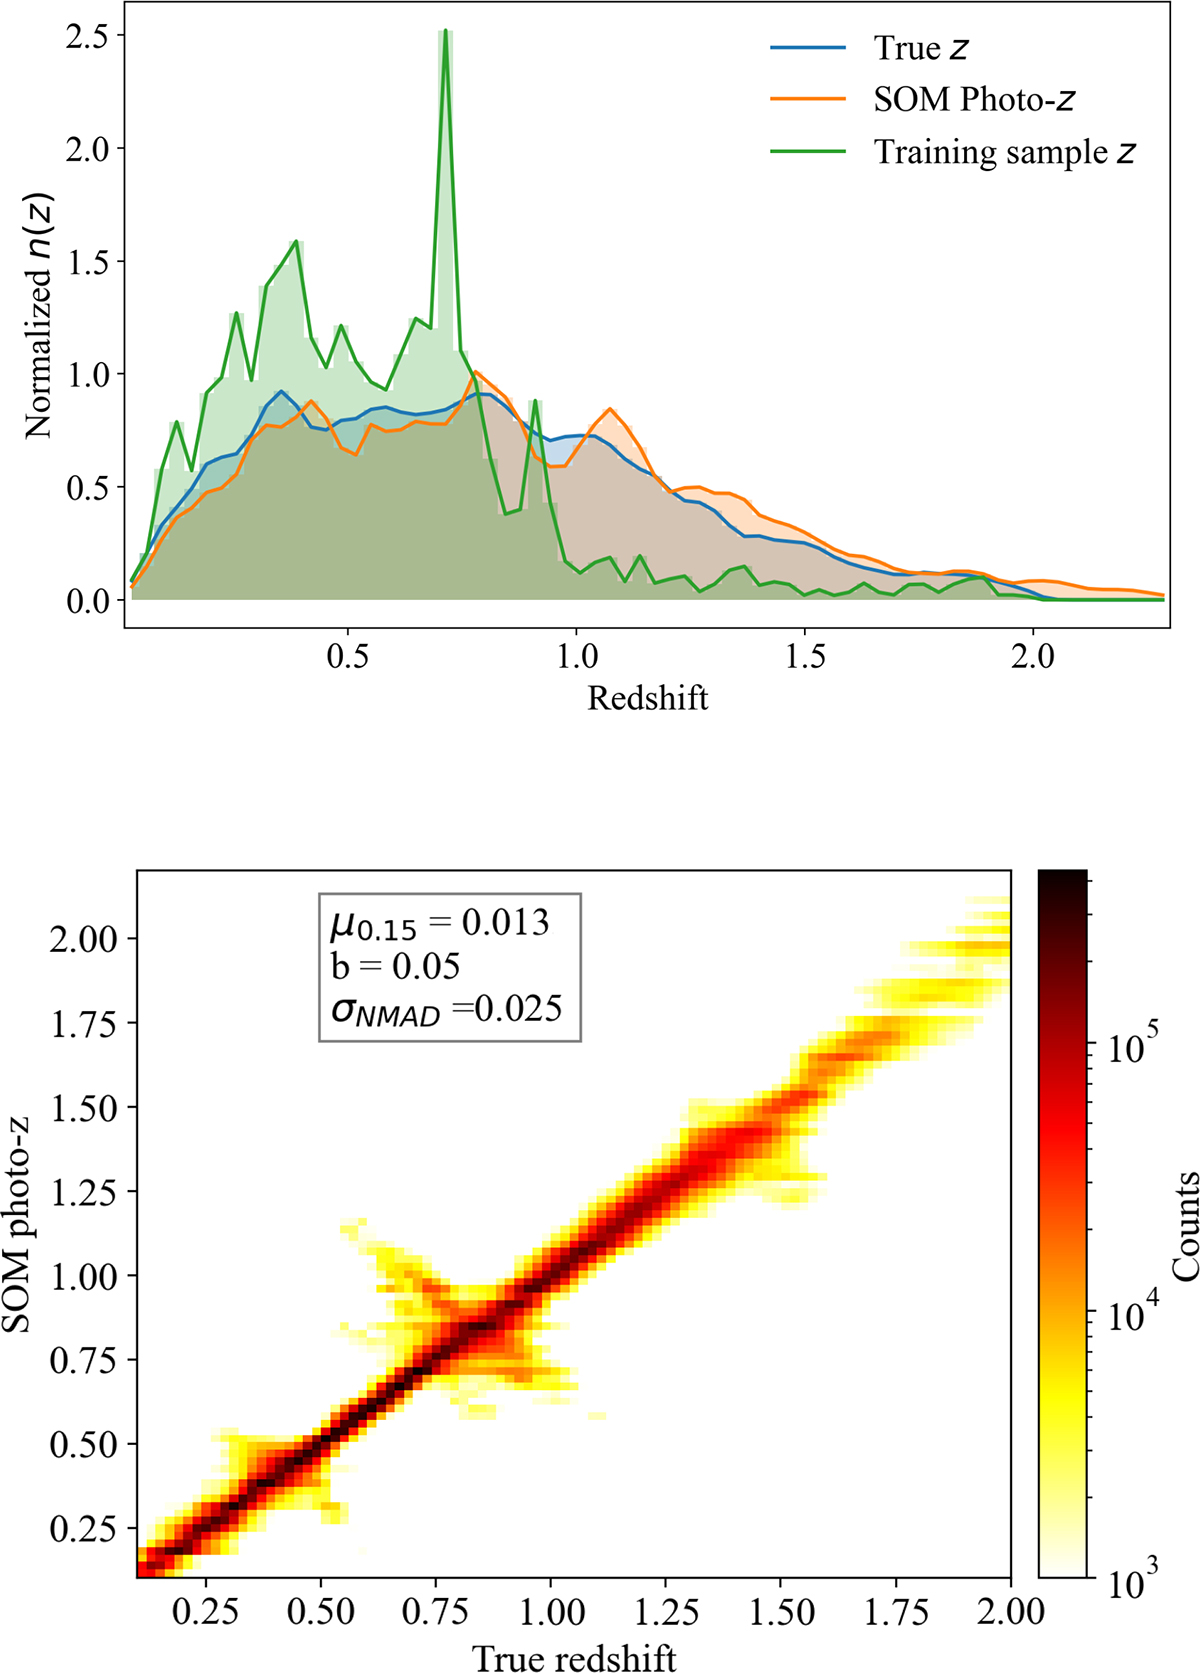
Fig. 1.
Download original image
SOM performance evaluation. The top panel shows the normalised distributions of the true redshift of galaxies from the simulated catalogue (blue), of the estimated photo-z generated with the SOM (orange), and of the sample used to train the SOM (green). The bottom panel shows the performance of the SOM in the estimation of the photo-z of galaxies.
Current usage metrics show cumulative count of Article Views (full-text article views including HTML views, PDF and ePub downloads, according to the available data) and Abstracts Views on Vision4Press platform.
Data correspond to usage on the plateform after 2015. The current usage metrics is available 48-96 hours after online publication and is updated daily on week days.
Initial download of the metrics may take a while.