Fig. D.1.
Download original image
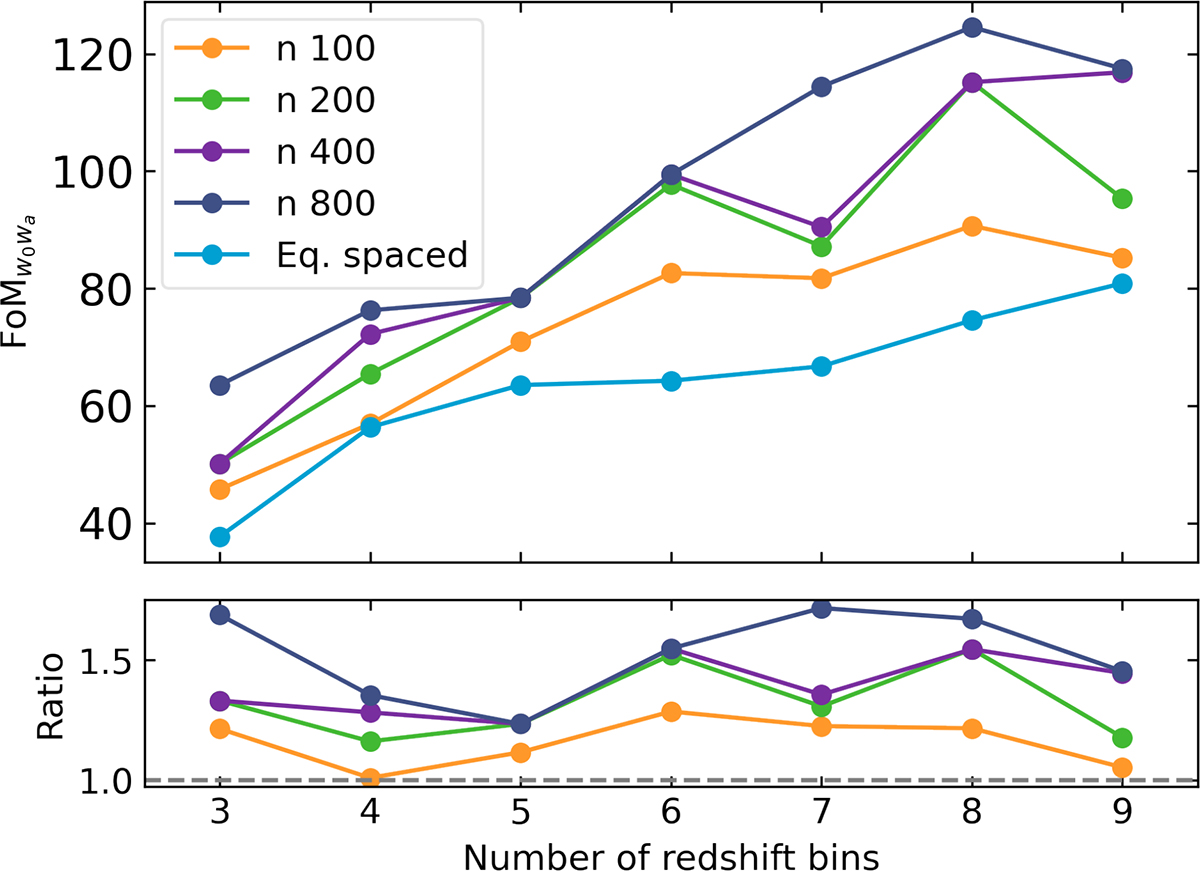
Simultaneous optimisation of the source and lens samples. Each line corresponds to the FoM of the best-performing tomography when randomly sampling both the source and lens tomographic configurations. The parameter ’n’ corresponds to the total number of runs, with n = 800 being the same number of runs needed for the 4 iterations of the iterative optimisation.
Current usage metrics show cumulative count of Article Views (full-text article views including HTML views, PDF and ePub downloads, according to the available data) and Abstracts Views on Vision4Press platform.
Data correspond to usage on the plateform after 2015. The current usage metrics is available 48-96 hours after online publication and is updated daily on week days.
Initial download of the metrics may take a while.