Open Access
Fig. E.1.
Download original image
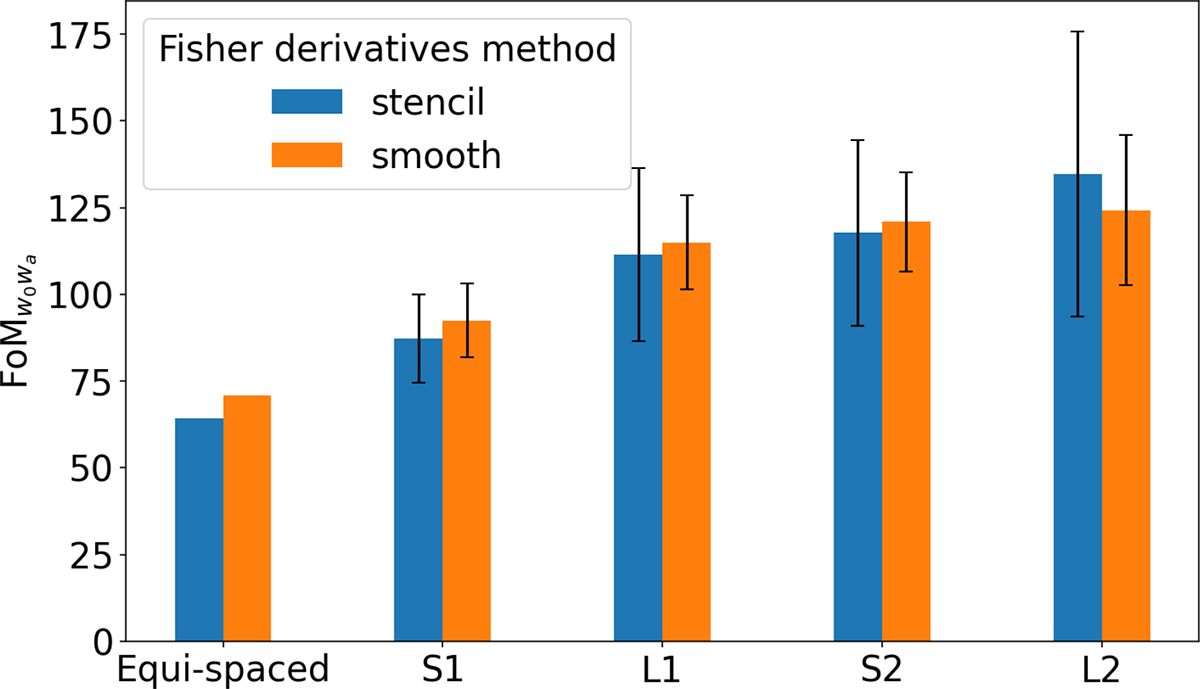
Comparison of the performance of the optimisation method using the smooth method or the stencil method to compute the derivatives of the Fisher matrix. Showing the average best FoM of each iteration over 5 realisations of the optimisation method for 6 tomographic bins along with the associated standard deviation.
Current usage metrics show cumulative count of Article Views (full-text article views including HTML views, PDF and ePub downloads, according to the available data) and Abstracts Views on Vision4Press platform.
Data correspond to usage on the plateform after 2015. The current usage metrics is available 48-96 hours after online publication and is updated daily on week days.
Initial download of the metrics may take a while.