Fig. 5.
Download original image
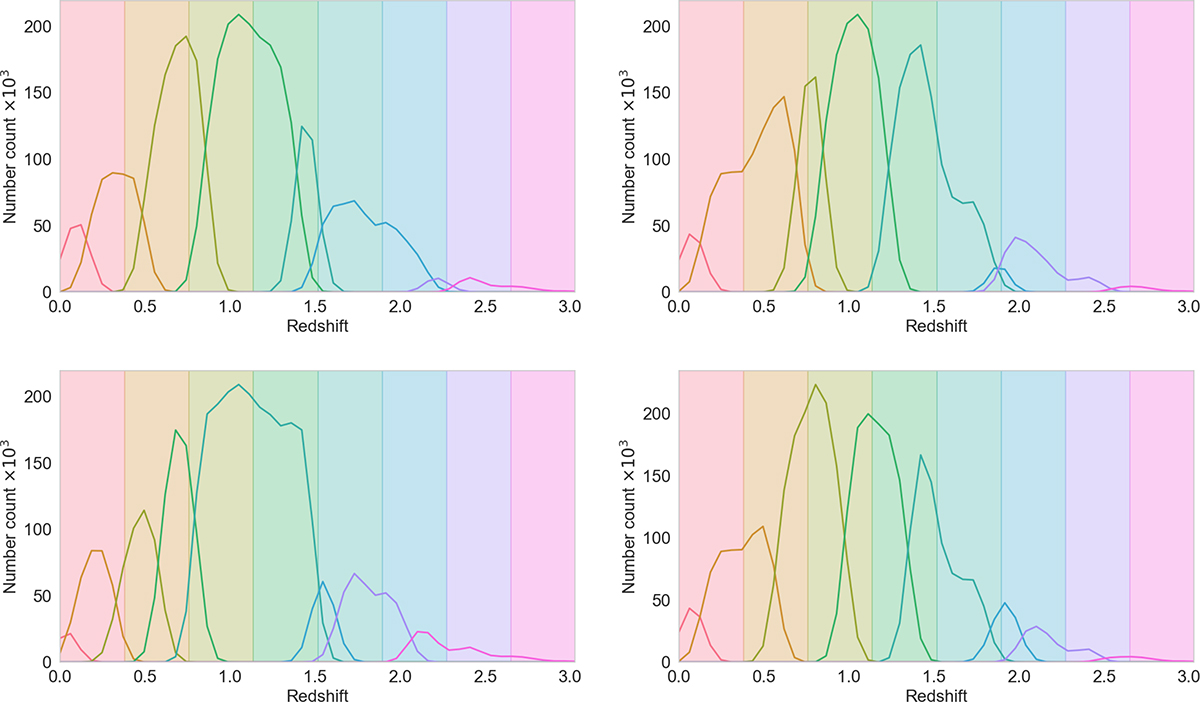
Galaxy number counts for source (left) and lens (right) galaxies for eight redshift bins over several iterations of the optimisation method applied for the dynamical DE model parameters w0wa. The top left panel corresponds to the source sample after the first iteration (S1), the top right panel corresponds to the lens sample after the first iteration (L1), the bottom left panel corresponds to the source sample after the second iteration (S2), and the bottom right to the second iteration of the lens sample (L2). The coloured bands represent the bin edges for the base case of equally spaced bins.
Current usage metrics show cumulative count of Article Views (full-text article views including HTML views, PDF and ePub downloads, according to the available data) and Abstracts Views on Vision4Press platform.
Data correspond to usage on the plateform after 2015. The current usage metrics is available 48-96 hours after online publication and is updated daily on week days.
Initial download of the metrics may take a while.