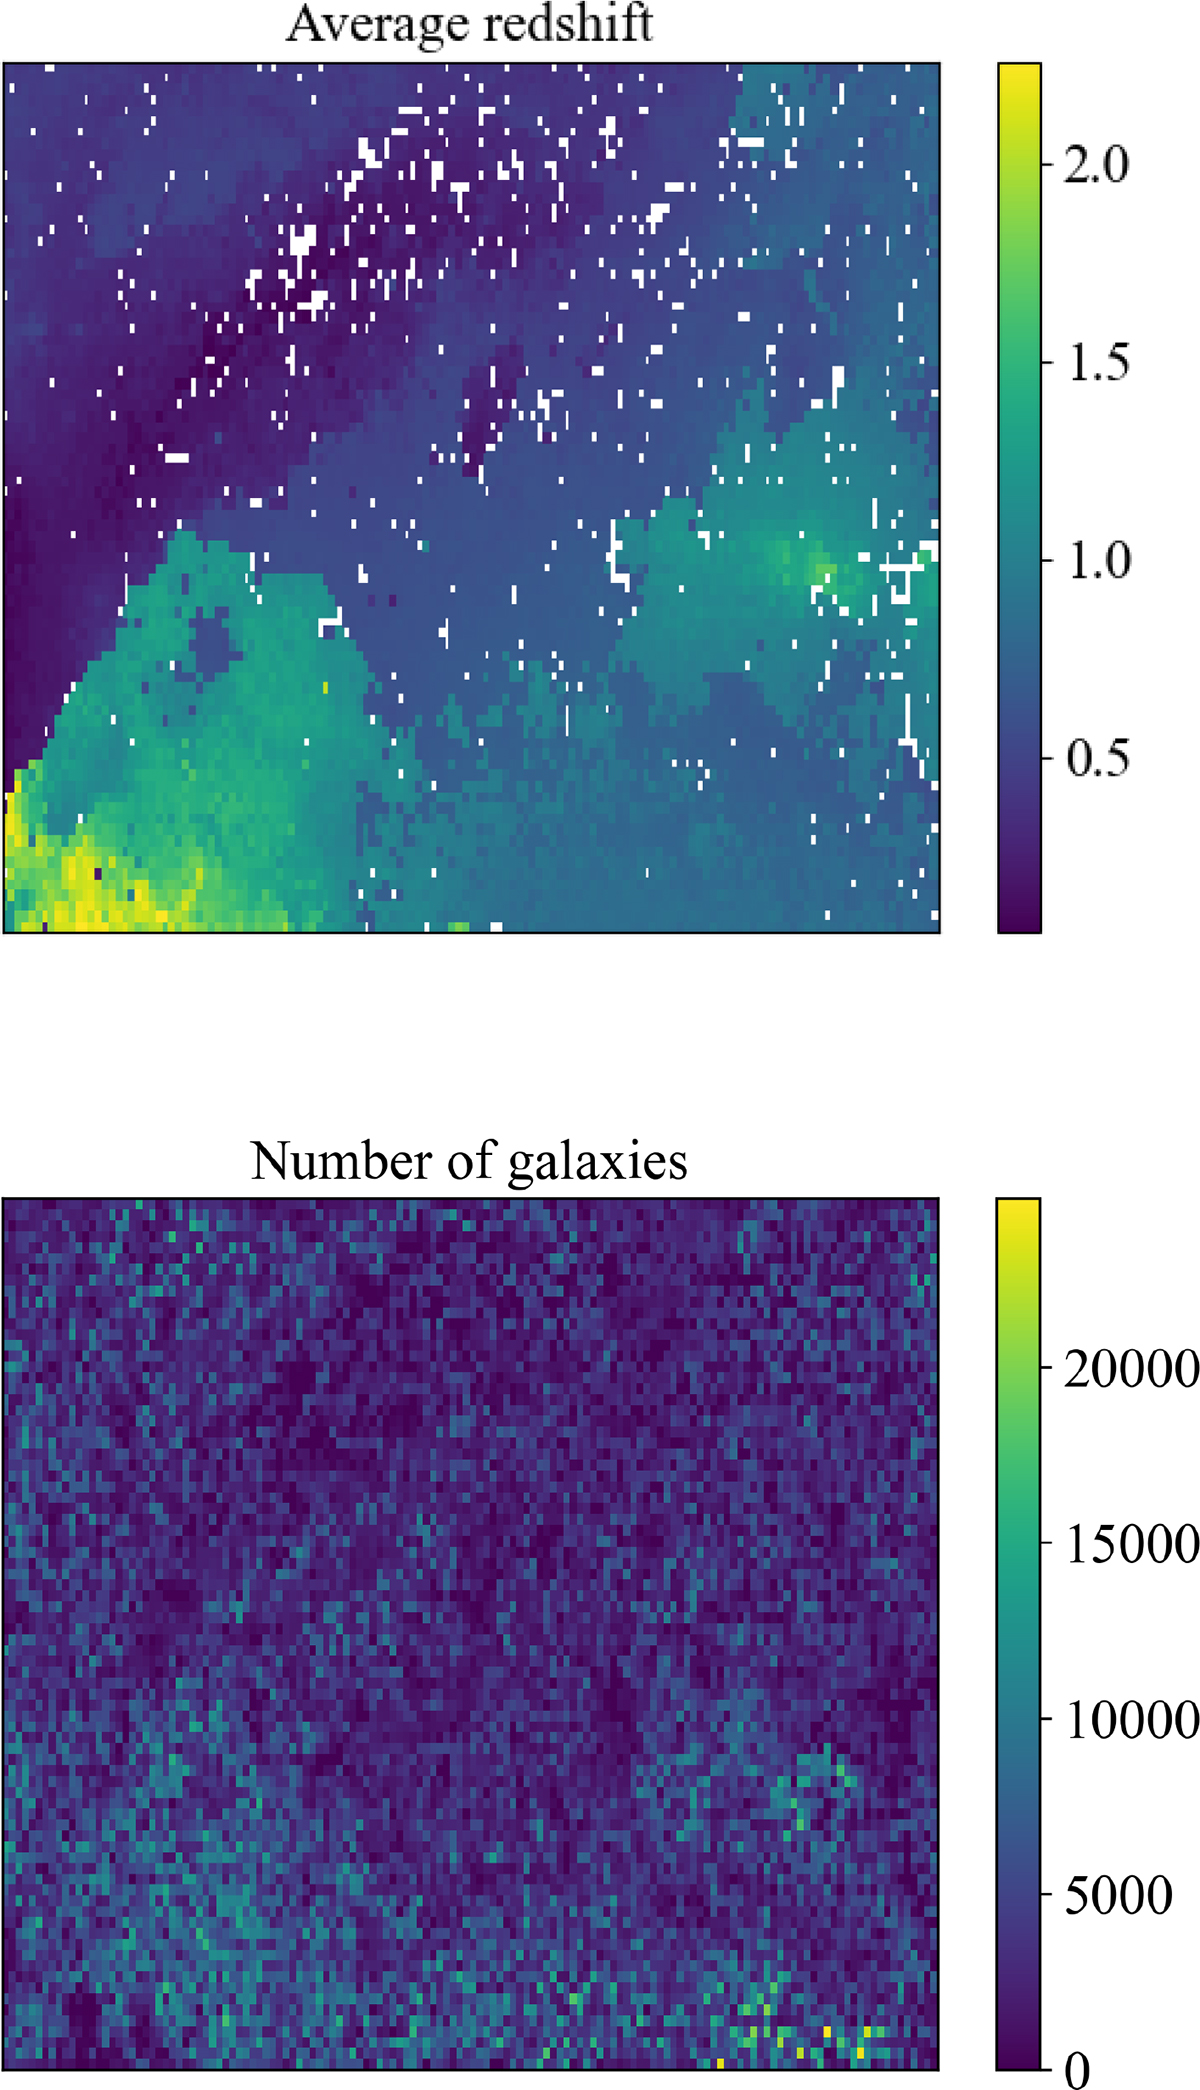
Fig. A.1.
Download original image
SOM visualisations. The top panel shows the redshift map of the SOM. The average redshift of the galaxies from the training sample is assigned to each voxel in the map. White voxels had no galaxies assigned during training. The bottom panel shows the galaxy density map of the SOM. The number of photo-z galaxies that are assigned to each voxel.
Current usage metrics show cumulative count of Article Views (full-text article views including HTML views, PDF and ePub downloads, according to the available data) and Abstracts Views on Vision4Press platform.
Data correspond to usage on the plateform after 2015. The current usage metrics is available 48-96 hours after online publication and is updated daily on week days.
Initial download of the metrics may take a while.