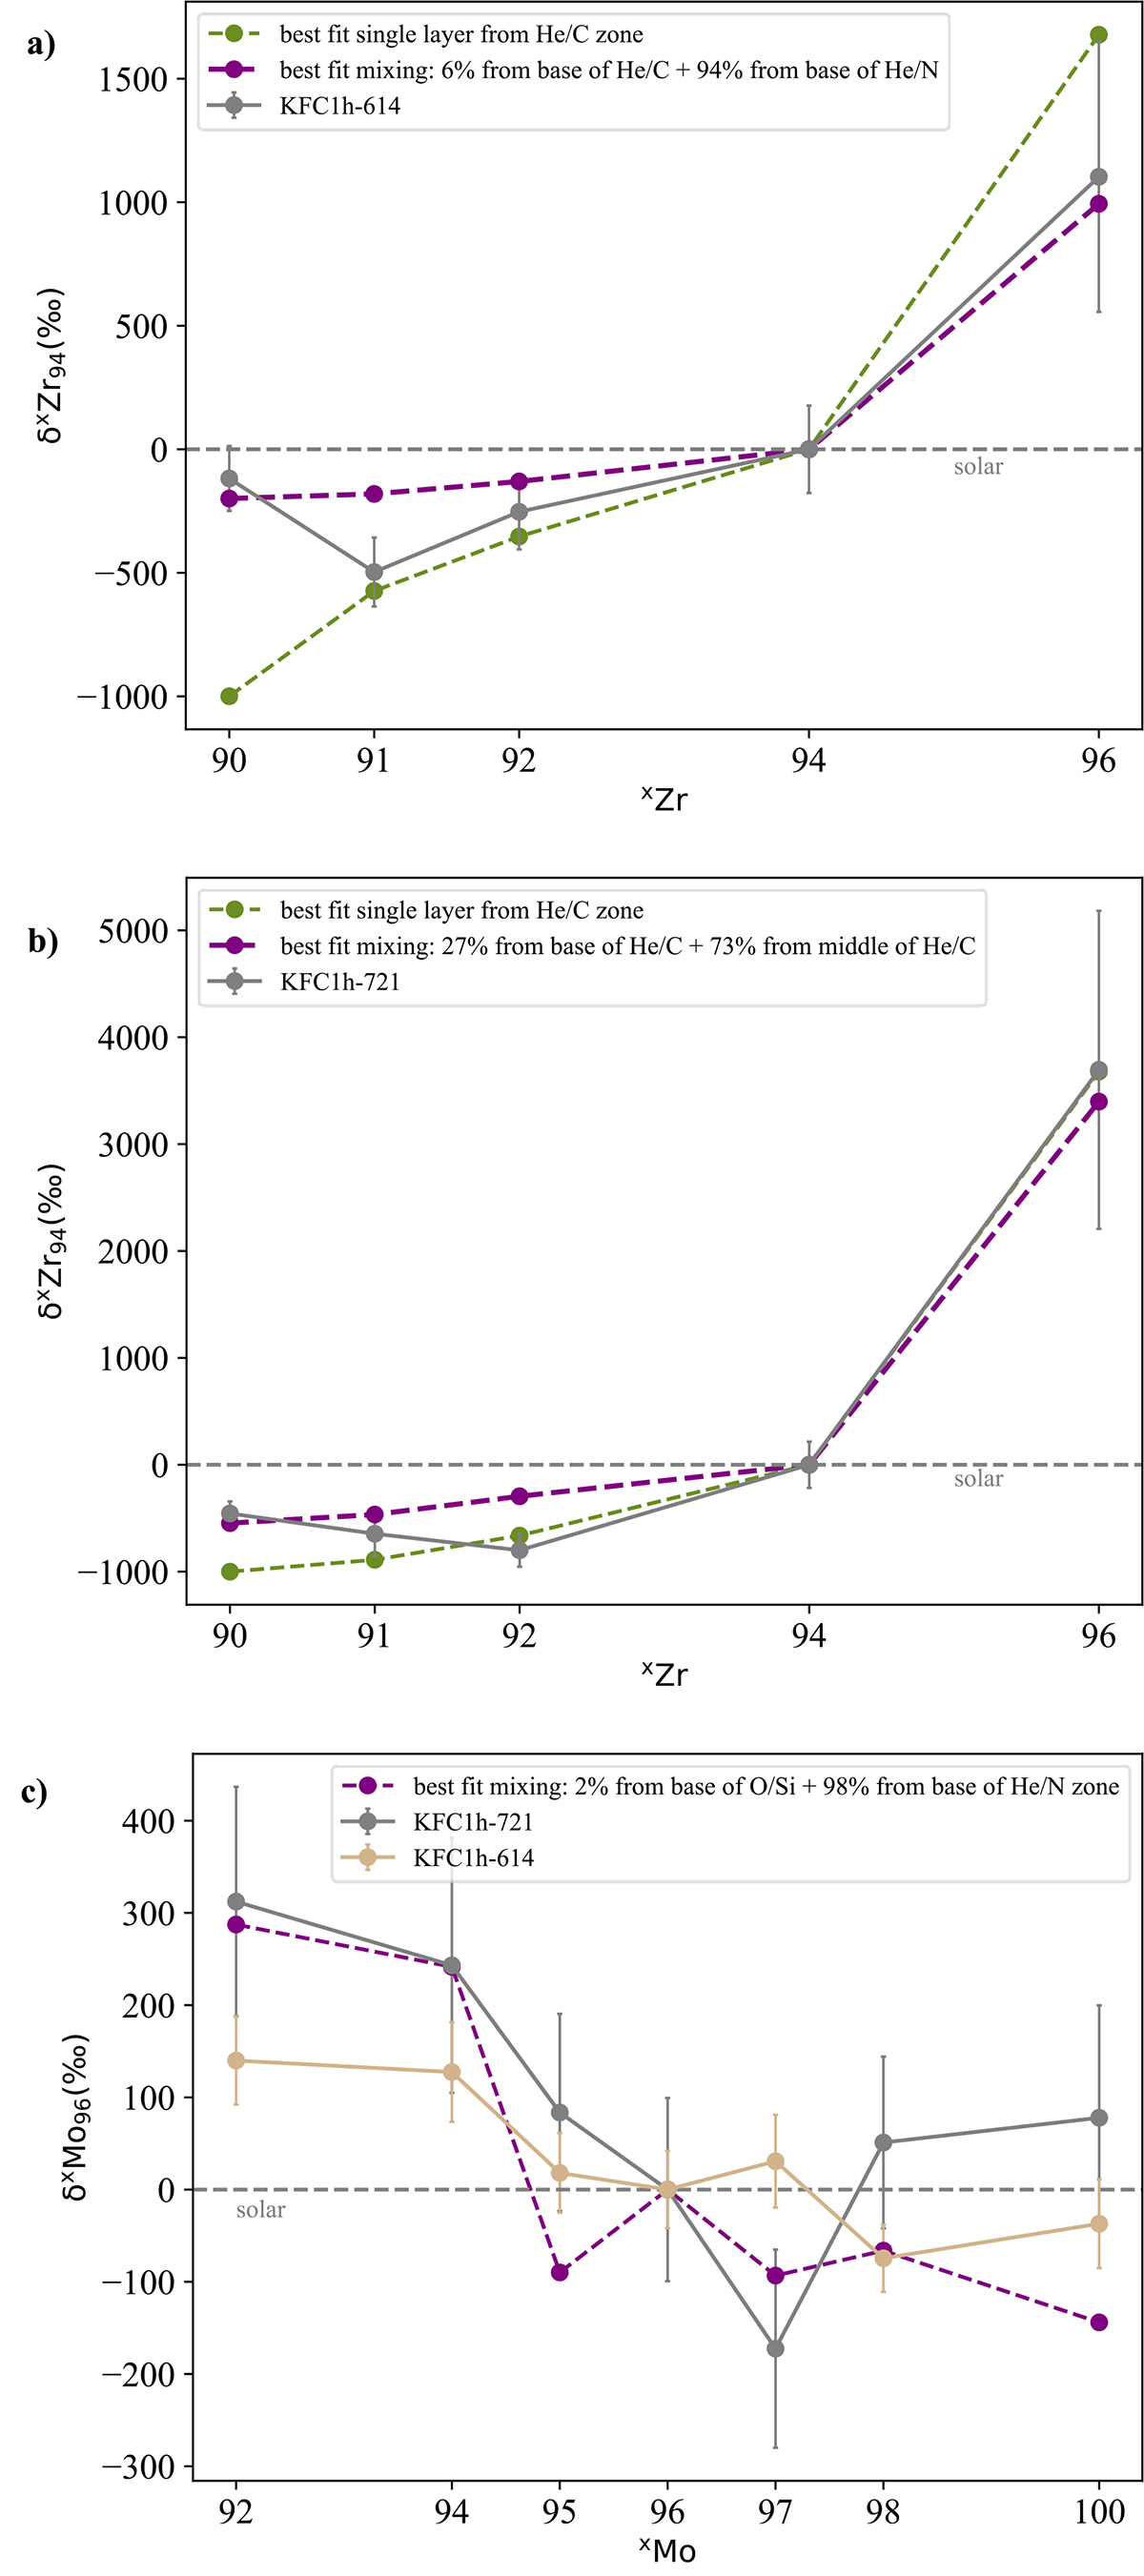
Fig. 4.
Download original image
Comparison of Zr data in grains to CCSNe models. (a) and (b) Zirconium isotopic ratios vs. atomic masses measured in anomalous subgrains in grains KFC1h-614 and KFC1h-721 and best-fit mixing lines obtained from the RIT15 model. (c) Molybdenum isotopic ratios vs. atomic masses of Mo isotopes measured in anomalous subgrains in grains KFC1h-614 and KFC1h-721. The best result from our two-layer mixing calculations is shown by the purple dashed line. Grey dashed line indicates the solar isotopic values. All errors bars show 1σ variation.
Current usage metrics show cumulative count of Article Views (full-text article views including HTML views, PDF and ePub downloads, according to the available data) and Abstracts Views on Vision4Press platform.
Data correspond to usage on the plateform after 2015. The current usage metrics is available 48-96 hours after online publication and is updated daily on week days.
Initial download of the metrics may take a while.