| Issue |
A&A
Volume 708, April 2026
|
|
|---|---|---|
| Article Number | A42 | |
| Number of page(s) | 12 | |
| Section | Stellar structure and evolution | |
| DOI | https://doi.org/10.1051/0004-6361/202556719 | |
| Published online | 26 March 2026 | |
The stellar origins of 96Zr excesses in presolar graphites from the Murchison meteorite
1
Department of Physics, University of Louisiana at Lafayette, Lafayette, LA 70503, USA
2
Nuclear and Chemical Sciences Division, Lawrence Livermore National Laboratory, Livermore, CA, USA
3
Konkoly Observatory, Research Centre for Astronomy and Earth Sciences, HUN-REN, Konkoly Thege M. út 15-17, H-1121 Budapest, Hungary
4
CSFK, MTA Centre of Excellence, Konkoly Thege Miklós út 15-17, Budapest H-1121, Hungary
5
NuGrid Collaboration, http://nugridstars.org
6
University of Bayreuth, BGI, Universitätsstraße 30, 95447 Bayreuth, Germany
7
Istituto Nazionale di Fisica Nucleare – Laboratori Nazionali del Sud, Via Santa Sofia 62, Catania I-95123, Italy
8
ELTE Eötvös Loránd University, Institute of Physics and Astronomy, Pázmány Péter sétány 1/A, Budapest 1117, Hungary
9
School of Physics and Astronomy, Monash University, Clayton, VIC 3800, Australia
10
Department of Experimental Physics, Institute of Physics, University of Szeged, Dóm tér 9, H-6720 Szeged, Hungary
11
Department of Physics and Astronomy, University of Victoria, British Columbia, V8W 2Y2, Canada
12
Department of Physics and Astronomy, Clemson University, Clemson, SC 29634, USA
13
Department of Geoscience, University of Wisconsin-Madison, Madison, WI 53706, USA
14
Department of Physics and McDonnell Center for the Space Sciences, Washington University, St. Louis, MO 63130, USA
★ Corresponding author: This email address is being protected from spambots. You need JavaScript enabled to view it.
Received:
1
August
2025
Accepted:
26
November
2025
Abstract
Context. Zirconium-96 is a stable isotope that can be synthesized under different neutron-rich nucleosynthetic conditions. Astrophysical models predict its production to occur in various stellar environments: from low-to-intermediate-mass asymptotic giant branch (AGB) stars to massive stars and core-collapse supernovae.
Aims. Detections of 96Zr excesses, in combination with other isotopic measurements from presolar grains can provide unique constraints on its stellar origin. Presolar grains are microscopic particles found in primitive Solar System materials, which formed in stellar winds and supernova ejecta. The isotopic composition of each grain can provide us a snapshot of the nucleosynthetic processes that took place during the parent star’s lifetime.
Methods. In this study, we measured the stable isotopes of C, N, O, Mo, Zr, and Ru in high-density presolar graphite grains from the Murchison meteorite and found four grains that contain positive isotopic anomalies in 96Zr carried by their internal subgrains. We analyzed multi-element isotopic datasets from each grain to explore the source of the observed 96Zr excesses.
Results. Comparisons with stellar models indicate that two grains likely condensed in an intermediate-mass AGB star with initial metallicity of Z ≤ 0.014. Their 96Zr/94Zr ratios also match those predicted for born-again AGB stars undergoing a very late thermal pulse and rapidly accreting white dwarfs. After comparing the relative populations of the aforementioned dust-producing stars, we propose rapidly accreting white dwarfs as a new, and more likely, stellar source for one of the presolar grains. The remaining two grains could have originated in the supernova ejecta of massive stars, due to correlated excesses in the p-nuclides, 92, 94Mo. Thus, grains with 96Zr anomalies can have a variety of stellar origins, in agreement with theoretical studies.
Conclusions. Our study highlights the importance of multi-element analysis in constraining the types of stars where presolar grains have condensed. These data will help improve our understanding of various nucleosynthesis processes in different stellar phases.
Key words: astrochemistry / nuclear reactions / nucleosynthesis / abundances / methods: analytical / meteorites / meteors / meteoroids / stars: AGB and post-AGB / supernovae: general
Currently at the Centre for Space Science and Human Systems, IHRI, Birkirkara, BKR 9037, Malta.
© The Authors 2026
 Open Access article, published by EDP Sciences, under the terms of the Creative Commons Attribution License (https://creativecommons.org/licenses/by/4.0), which permits unrestricted use, distribution, and reproduction in any medium, provided the original work is properly cited.
This article is published in open access under the Subscribe to Open model. This email address is being protected from spambots. You need JavaScript enabled to view it. to support open access publication.
1. Introduction
Presolar grains are submicrometer- to micrometer-sized particles that condensed from and evolved around stellar objects, which are found in primitive materials in the Solar System. Compared to the bulk Solar System, presolar grains contain highly anomalous isotopic signatures that are too large to be explained by chemical fractionation during Solar System evolution. Rather, these grains are pieces of stars that preserve the nucleosynthetic processes that occur within stars (Zinner 2014). Presolar grains can occur as varied different phases, among which graphites are the least abundant of the carbonaceous phases, after nanodiamonds and SiCs. On average, presolar graphite grains are some of the largest grains (∼3−5 μm in diameter), which facilitates multi-element, isotopic measurements on single grains by offering more material to analyze. Additionally, presolar graphites contain small refractory subgrains (Bernatowicz et al. 1991, 1996; Croat et al. 2003, 2005) that are the sources of heavy element isotopic anomalies (Pal et al. 2022, 2023, 2025). Multi-element isotopic measurements are essential to identify stellar sources of presolar grains as they provide tighter constraints on models of stellar evolution and nucleosynthesis than single element isotopic analyses. Recent advances in high-sensitivity precision isotope measurement techniques, such as resonance ionization mass spectrometry (RIMS), make it possible to analyze the isotopic compositions of multiple trace heavy elements simultaneously in micrometer-sized stardust grains (e.g., Savina et al. 2023). The ability of RIMS to eliminate the isobaric interferences that are common during heavy element mass spectrometry makes it the ideal method for heavy element isotope analyses of presolar grains (e.g., Savina et al. 2003; Stephan et al. 2016; Savina et al. 2018).
Presolar graphite grains of low (1.6−2 ± 0.1 g/cm3) and high density (2 ± 0.1−2.2 ± 0.1 g/cm3) are found to condense around different stellar parents. Majority of low-density (LD) graphites show signatures that indicate an origin in the ejecta of core-collapse supernovae (CCSNe; e.g., Amari et al. 1995; Nittler et al. 1996; Jadhav et al. 2013a). In contrast, a majority of the high-density (HD) graphites come from low-mass, low-metallicity asymptotic giant branch (AGB) stars (e.g., Amari et al. 2014; Jadhav et al. 2013a). However, a minority of HD graphites might have originated in post-AGB stars (Jadhav et al. 2013b), core-collapse supernovae (Jadhav et al. 2013a), and novae (Haenecour et al. 2016). Thus, the isotopic abundances measured in HD graphites can provide information about various nucleosynthesis processes that occur in different dust-producing stellar objects.
Zirconium has five stable isotopes: 90Zr, 91Zr, 92Zr, 94Zr, 96Zr. No Zr isotope is exclusively made by the s-process; however, the lightest four isotopes (90Zr, 91Zr, 92Zr, 94Zr) present today in the Solar System were mostly produced by the s-process (Bisterzo et al. 2014). Due to their low neutron capture cross sections (90Zr is neutron-magic), 90, 91, 92, 94Zr are sensitive to the overall exposure to neutrons (Lugaro et al. 2014). The exception is 96Zr, where the relatively short half-life of 95Zr (64 days) acts against neutron capture under classical s-process conditions (neutron densities Nn ≅ 107 cm−3; see e.g., Käppeler et al. 2011). However, in a more neutron-rich environment (Nn > 3 × 108 cm−3), neutron capture on 95Zr can compete with β-decay and leads to the production of 95Zr. According to stellar nucleosynthesis calculations, this might occur in both massive stars and AGB stars (Lugaro et al. 2023 and references therein). Therefore, 96Zr excesses in presolar grains provide an observational benchmark for nucleosynthesis models of both low-mass stars and massive stars.
Heavy element isotopic studies on individual graphites were first carried out by Nicolussi et al. (1998) but remain scarce to this day. This study measured the isotopes of Mo and Zr on HD graphites (KFC1 density fraction) from the Murchison meteorite, but did not have light element data to characterize the grains. Later, Jadhav et al. (2012) measured Zr isotopes, along with other heavy and light elements on HD grains from the Orgueil meteorite. Both these studies reported high 96Zr/94Zr ratios in two (Nicolussi et al. 1998) and one (Jadhav et al. 2012) studied HD graphites. Both studies speculate these grains to have origins different from AGB stars. In our study, we examine both light (C, N, O) and heavy element (Mo, Zr, Ru) isotopic measurements of graphite grains from the same high-density fraction (KFC1) of Murchison as that of Nicolussi et al. (1998). We report four more HD graphite grains that contain 96Zr excesses. Along with the light element isotopes, we use the simultaneously measured Mo isotopes on these grains to explore their stellar progenitors.
2. Experimental results
We measured the isotopic compositions of Zr, Mo, and Ru simultaneously in 19 grains from the KFC1 density fraction (2.15−2.20 g/cm3) of Murchison. Heavy element isotopic measurements were done using the RIMS instrument Laser Ionization of Neutrals (LION) at the Lawrence Livermore National Laboratory. Details on the RIMS technique, measurement protocols, and data reduction can be found in the appendix. All 19 grains were previously measured for 12, 13C, 14, 15N, and 16, 17, 18O (Amari et al. 2017), using a NanoSIMS 50 at Washington University and a Cameca IMS-1280 at the University of Wisconsin-Madison (see the appendix for more details). The Ru signals for all grains were at or below the background signal and are not discussed further.
During the RIMS measurements, the grains were slowly consumed over a period of 10 to 30 minutes. The Zr and Mo count rates appeared heterogeneously distributed throughout the grain, as described in detail below. We reported δ96Zr values for the 16 grains that had 96Zr counts above the background signal (Fig. 1), where δ96Zr is the deviation (in per mil) of the 96Zr/94Zr ratio from the Solar System value (δ96Zr = 1000[(96Zr/94Zr)sample/(96Zr/94Zr)solar − 1]). Most of the grains are depleted in 90, 91, 92, 96Zr relative to 94Zr. Twelve grains with 96Zr counts above the background had low 96Zr signals during the bulk of the measurement. The remaining four grains (grains KFC1h-343, -524, -614, and -721) had bursts of 96Zr signal over the entire grain analysis. These four grains contain significant excesses in 96Zr (Fig. 1c, Table 1). Although the δ96Zr anomalies are not uniformly distributed in these grains, 96Zr-excesses are still obtained when summing the signal for an entire grain. Similar bursts of signals were observed for Sr isotopic data in HD graphites from the KFB1 density fractions of Murchison (Pal et al. 2025). We infer that the observed δ96Zr anomalies most likely originate from subgrains embedded within the graphite grains (Bernatowicz et al. 1996; Croat et al. 2005). The count rates of trace elements (Mo, Zr) from the subgrains are elevated compared to that from the graphite matrix which, when averaged over the entire grain, dilutes the anomaly. We isolated high count rate events during data reduction and discuss the anomalous signatures from the subgrains to understand their stellar origins.
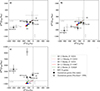 |
Fig. 1. Comparison of grain data to AGB stellar models. Three-isotope Zr plots of KFC1h presolar HD graphite grains. The four grains with positive δ96Zr94 values are indicated as black full circles, all the others as grey full circles. Two KFC1h grains with positive δ96Zr94 that were previously analyzed by Nicolussi et al. (1998) are shown as open squares. Isotopic ratios in the envelopes of various low-mass AGB stars at solar (Z = 0.014; Z is the mass fraction of elements heavier than He) and subsolar metallicities (Karakas et al. 2018) are shown as colored lines. Markers along these prediction lines indicate isotopic ratios when the stellar envelope is C-rich (C > O), which is the condition for the formation of graphite grains. The horizontal and vertical grey dashed lines represent solar ratios. The uncertainties are 1σ. |
Light and heavy isotopic data of subgrains, with grain average (in brackets), for four KFC1 graphites from Murchison with 96Zr excesses.
All isotopic data measured in the four graphite grains with anomalous trace element isotopes are presented in Table 1. All uncertainties reported in this article are 1σ. The first subgrain that exhibits an excess in 96Zr, KFC1h-343, has a Zr anomaly of δ96Zr = 1069 ± 255‰ and a mild excess in the s-only isotope, 96Mo (e.g., δ92Mo/96Mo = −217 ± 60‰). The light element measurements of this graphite grain show a mild excess in 12C (12C/13C = 167.7 ± 3.1), but no significant deviation from terrestrial values in the N and O isotopic compositions. Grain KFC1h-524 contains a subgrain or numerous subgrains with a substantial 96Zr excess (δ96Zr = 1831 ± 328‰) and solar values for Mo isotopic ratios. This grain has a very low 12C/13C ratio (12C/13C = 12.9 ± 0.2) with normal to solar ratios N, O, and Mo isotopes. We note that while this grain appears to have a slight excess in 18O(δ18O/16O = 119 ± 8‰) most grains on this KFC1h mount have higher than the solar value, with an average δ18O = 55 ± 12‰ for the mount (Amari et al. 2017). The other two grains (KFC1h-614 and KFC1h-721) with 96Zr enriched subgrains show peculiar anomalies in Mo isotopes. Subgrain(s) in KFC1h-614 (δ96Zr = 1103 ± 547‰) have 90, 91, 92Zr/94Zr isotopic ratios within 2σ uncertainties of solar, but contain excesses in the p-process isotopes, 92Mo and 94Mo (δ92Mo/96Mo = 140 ± 48‰, δ94Mo/96Mo = 127 ± 54‰). NanoSIMS measurements of light element isotopes in the host graphite grain KFC1h-614 show no deviation from terrestrial values in C, N, and O isotopes. A larger excess in 96Zr is observed in KFC1h-721 (δ96Zr = 3695 ± 1488‰) also containing excesses in 92Mo (δ92Mo/96Mo = 312 ± 124‰) and 94Mo (δ94Mo/96Mo = 243 ± 138‰). This grain has the highest 12C/13C ratio (662.5 ± 14.5) and close-to-solar values of the N and O isotopic ratios.
In summary, 4 of the 19 KFC1 grains contain subgrains with 96Zr excesses: 2 grains (KFC1h-524, -721) contain substantial excesses in 96Zr, and two (KFC1h-343, 614) with small excesses; all 4 grains are depleted in 90, 91, 92Zr with respect to 94Zr (Table 1 and Fig. 1). Subgrains in KFC1h-614 and KFC1h-721 also show excesses in the p-only 92Mo, and 94Mo. Carbon isotopic ratios of the host graphite grains vary greatly (12C/12C ∼ 13 to 663), while the N and O isotopic ratios are solar within uncertainties.
3. Discussion
In this section, we use correlated, multi-element isotopic data of the four grains with 96Zr-excesses to find their stellar progenitors. We compare the data discussed above with nucleosynthesis models of four different kinds of stellar objects. We also explore mixing in stellar ejecta as a contributor to the observed isotopic anomalies.
3.1. Comparison to AGB stellar models
Previous studies have identified AGB stars as progenitor sites for the majority of HD graphites (Amari et al. 2014; Jadhav et al. 2013a). In AGB stars, the s-process occurs in the He-intershell region between the He- and H-burning shells (e.g., Gallino et al. 1998; Herwig 2005; Karakas & Lattanzio 2014; Cristallo et al. 2015; Battino et al. 2016; Lugaro et al. 2018). The H-shell burns radiatively over a 103–105 year time scale, alternating with convective thermal pulses (TPs) that are short (∼100 years) He-shell-burning events. At the end of each TP event, before the reactivation of the H shell, s-process and C-rich material from the He intershell can be mixed into the convective envelope in a process known as third dredge-up (TDU, e.g., Straniero et al. 1995; Herwig 2005). The TDU is a recurrent event, carrying some of the intershell heavy elements produced by s-process nucleosynthesis to the surface where they are eventually ejected in stellar winds and condense in circumstellar grains. The isotope 13C is the main contributor of neutrons to the s-process in AGB stars, through the 13C(α,n)16O reaction. This reaction occurs at temperatures ∼90 MK and produces a steady supply of neutrons at a low neutron density of ∼107 cm−3 (e.g., Straniero et al. 1995; Herwig et al. 1999; Goriely & Mowlavi 2000; Lugaro et al. 2003; Battino et al. 2016; Trippella et al. 2016; Cristallo et al. 2018). In AGB stars, the 22Ne(α,n)25Mg might be partially activated if the temperature at the bottom of the He-burning TP reaches above 300 MK (Karakas & Lattanzio 2014 and references therein). This reaction can produce neutron densities up to several 1010 cm−3 in low-mass AGB stars (e.g., Gallino et al. 1998) and ∼1013 cm−3 in massive AGB stars (e.g., Fishlock et al. 2014). These high neutron densities affect the branching points in neutron-capture reactions and can affect the isotopic compositions of elements (Lugaro et al. 2023). High neutron densities can increase the 96Zr/94Zr ratio by allowing unstable 95Zr to capture neutrons before it β-decays (Lugaro et al. 2003, 2014; Bisterzo et al. 2015).
Most of our measured grains are depleted in 90, 91, 92, 96Zr relative to 94Zr, as is typically predicted by AGB s-process models (e.g., Gallino et al. 1998; Cristallo et al. 2011; Karakas & Lugaro 2016) and observed in presolar SiC grains from these stars (Nicolussi et al. 1997; Lugaro et al. 2003; Barzyk et al. 2007). In Fig. 1, we compare grain data to low mass (≲3 M⊙), solar and subsolar metallicity AGB stellar nucleosynthesis models from Karakas & Lugaro (2016) and Karakas et al. (2018). The general trend of our measurements (depletions in 90Zr, 91Zr, 92Zr, and 96Zr relative to 94Zr) are in agreement with the model predictions. The low-mass AGB models predict a depletion in 96Zr (Fig. 1c), whereas models with stellar masses greater than 3 M⊙ predict excesses in 96Zr relative to 94Zr (Fig. 2). In general, AGB stars with higher initial masses and/or lower initial metallicity reach higher temperatures at the bottom of the He intershell region, which causes more efficient activation of the 22Ne(α,n)25Mg reaction during the convective TP. The range of the predicted Zr isotopic ratios from AGB stars with C/O > 1 in their envelope matches the 96Zr anomalies observed in the studied grains, excluding grain KFC1h-721 (Fig. 2). The Zr isotopic composition of KFC1h-343, KFC1h-524, and KFC1h-614 can be matched within 2σ uncertainties by that of the C-rich envelope of 3−4 M⊙ AGB stellar models with Z = 0.014, 0.007, and 0.0028. The 96Zr excess of grain KFC1-5.01 (δ96Zr = 9377 ± 1251‰), reported by Nicolussi et al. (1998), can also be explained by these model predictions, especially with that of model 4 M⊙ and Z = 0.0028. The AGB stellar origin of KFC1h-343 is further supported by the mild s-process nucleosynthetic signature in Mo isotopes (depletions in all isotopes relative to 96Mo), as well as by its mild excesses in 12C and 14N (Table 1). The 12C/13C ratio measured in grain KFC1h-524 is significantly lower than solar (12C/13C = 13 ± 0.2; solar 12C/13C = 89). This is in agreement with AGB stars of low metallicities that undergo mild hot bottom-burning (HBB), consuming 12C at the base of the stellar envelopes (Karakas & Lugaro 2016). For example, AGB stellar models with 4−4.5 M⊙ and Z = 0.007 result in 12C/13C ratios between 6−25, that falls in the range of observed 12C/13C ratios of KFC1h-524. Furthermore, extra-mixing processes at the bottom of the AGB convective envelope may also affect the abundances of light and intermediate-mass isotopes (Palmerini et al. 2011 and references therein). Although the 96Zr excess in KFC1h-614 can be explained by the AGB model predictions discussed here (Fig. 2), the excesses in the p-nuclides, 92Mo and 94Mo, seen in subgrains of this grain exclude an AGB star as the progenitor for KFC1h-614 because p-nuclides are destroyed by the dominant s-process nucleosynthesis in AGB stars (e.g., Arlandini et al. 1999; Lugaro et al. 2003).
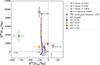 |
Fig. 2. Comparison of measured δ96Zr94 excesses to AGB models. The four subgrains with anomalous δ96Zr94 are shown as open circles. Zirconium isotopic ratios in the envelopes of AGB stars 3−4 M⊙ and low metallicity (Z = 0.0028 to 0.014) are plotted as colored lines, with markers indicating ratios in C-rich conditions in the envelope. Solar values of zero, by definition, are indicated with grey dashed lines. The uncertainties are 1σ. |
In summary, two of the reported grains with 96Zr excesses could originate in AGB stars. Using correlated multielement isotopic data, we are able to get tighter constraints on the stellar progenitors of the grains presented here. The isotopic ratios of light (C and N) and heavy elements (Mo and Zr) together indicate that grain KFC1h-343 originated from an AGB star with a mass range of 3−4 M⊙ and a metallicity range of Z = 0.0028 − 0.014. The C isotopic ratio of grain KFC1h-524, on the other hand, suggests that this grain could condense from an AGB star that was undergoing HBB.
3.2. Comparison to born-again AGB stars
At the end of the AGB phase, a star becomes progressively hotter and passes through the post-AGB phase and may even light up any surrounding gas to form a planetary nebula. Eventually, the star will begin descending down the white dwarf cooling track (e.g., Herwig 2005). During this post-AGB phase, the star has lost most of its envelope, only a thin residual layer of H is left on the surface, and the He-intershell is above the CO inert core. About 10 to 25% of post-AGB stars that are approaching the white-dwarf phase ignite He burning one last time in the He-intershell, resulting in a late thermal pulse (LTP) or a very-late thermal pulse (VLTP; Iben 1984; Herwig et al. 1999, 2011; Bertolami et al. 2006). This ignition causes the He-intershell to convect and the residual H from the surface is ingested into the convective zone. Protons from the ingested H layer convert some 12C to 13C, thus reducing the 12C/13C ratio. Carbon-13 also burns at the bottom of the He intershell via the 13C(α,n)16O reaction producing a neutron density of up to ∼1015 cm−3, which is typical for the intermediate neutron capture process or the i-process (Cowan & Rose 1977). The isotopic abundances are significantly altered in the He-intershell under these conditions, creating a distinct isotopic signature for born-again AGB stars, such as a low 12C/13C and a high abundance of 17O and neutron-rich isotopes (Herwig et al. 2011). A small fraction of HD graphite grains from Orgueil have previously been proposed to originate in born-again AGB stars. These grains exhibited extremely high Ca and Ti anomalies and very low 12C/13C ratios, typically less than 20 (Jadhav et al. 2013b). The authors matched these anomalies to the H-ingestion phase of a VLTP event where very low 12C/13C ratio (< 20) can be obtained as 13C is produced abundantly by the ingested protons in the He intershell during VLTP. This stellar scenario could also simultaneously explain their observed extreme Ca and Ti anomalies that are produced due to the availability of neutrons via the i-process.
Similarly, presolar SiC grains of type AB with similar low 12C/13C ratio (< 10) and s-process enrichments have also been proposed to originate from born-again AGB stars (Amari et al. 2001). Further, Fujiya et al. (2013) found three 13C-enriched presolar SiC AB grains with excesses in 32S that were attributed to born-again AGB stellar origins. The isotopic signatures of two mainstream presolar SiC grains from Murchison with negative δ134Ba/136Ba and low 12C/13C also matched the nucleosynthetic outputs from VLTP calculations of post-AGB stars (Liu et al. 2014). However, in this last case, it was found that Ba isotopic data also match new AGB stellar models with a lower β-decay rate for the s-process branching point at 134Cs (Li et al. 2021; Liu et al. 2022), which was the favored argument of Liu et al. (2014).
We chose to explore born-again AGB stars as a potential stellar source of KFC1h-524 because it has a low 12C/13C (∼12) and the subgrain in the graphite grain shows a large excess in 96Zr, the latter of which can be synthesized under high neutron flux conditions such as those of the i-process. We considered theoretical nucleosynthesis models of post-AGB stars undergoing VLTPs, which had been developed to reproduce Sakurai’s Object (Herwig et al. 2011). This object, first discovered in 1996 (Duerbeck & Benetti 1996), was initially thought to be a slow nova, but following subsequent high-resolution spectral observations, it was found to be undergoing a VLTP phase during white dwarf cooling (Asplund et al. 1997; Kipper & Klochkova 1997). The isotopic evolution in Sakurai’s Object was modeled with a progenitor AGB star of an initial mass of Minit = 2 M⊙ and Z = 0.01 (Herwig et al. 2011). The peak neutron density for Sakurai’s Object model is ∼1015 cm−3.
In Fig. 3a, we compare the observed 96Zr anomalies to the abundances obtained from the nucleosynthesis modeling of Sakurai’s Object. The four model lines represent four timescales of graphite subgrain formation by considering radiogenic contributions to Zr isotopes immediately after the nucleosynthesis was complete (at 0.02 year and 2 years after the event) under the assumption that all unstable precursors have decayed. All the models predict 96Zr/94Zr greater than what is observed in the grains from this study. The lighter isotopes of Zr are less abundant than 94Zr in the grains and best match the predictions of Sakurai’s Object only if no decay is considered (i.e., the dust formed at time = 0 after the nucleosynthesis). Contamination from Solar System material could explain the smaller anomalies observed in the grains compared to those predicted by the models. It is possible that signals from the Zr-rich subgrain(s) were diluted by that of the surrounding graphite material with a solar or s-process signature in Zr.
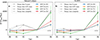 |
Fig. 3. Comparison of subgrain Zr data to born-again AGB star and RAWD models. Zirconium isotopic ratios vs. atomic masses of Zr isotopes for subgrains measured in grains with 96Zr-excesses are shown with colored lines in panels a and b, respectively. Zirconium isotopic ratios from born-again AGB Sakurai’s Object (Herwig et al. 2011) and RAWD-B (Denissenkov et al. 2017) are plotted as grey dotted lines in the left and right column respectively. Results from four different decay times are shown with different markers as indicated in the legend. Grey dashed line represent the solar values. All errors show 1σ variation. |
Although the excesses in 96Zr in grains KFC1h-343, KFC1h-524, KFC1h-614, and KFC1h-721 could be explained on the basis of born-again AGB star nucleosynthesis models that have undergone a VLTP (Fig. 3a) and been diluted by Solar System contamination, their negative δ-values for 90, 91, 92Zr/94Zr ratios cannot be explained by post-AGB stellar predictions. The observed low 12C/13C of KFC1h-524 might support the plausibility of its origin in a born-again AGB star; however, mild HBB in AGB stars could also potentially explain the 12C/13C ratio. In contrast, KFC1h-343 has a higher than solar 12C/13C ratio (168 ± 3), which does not offer any evidence of the grain originating in a born-again AGB star. For KFC1h-721 and KFC1h-614, in addition to their 12C/13C ratio, the presence of excesses in the p-nuclides of Mo rules out a born-again AGB star origin. One of two 96Zr-excess grains (KFC1-C.14) reported by Nicolussi et al. (1998), which has solar 90, 91, 92Zr/94Zr ratios and a δ96Zr/94Zr value of 1546 ± 268‰, also match the born-again AGB stellar model predictions (Fig. 3a).
To summarize, one of the four grains with reported 96Zr excesses (KFC1h-524) has C and Zr isotopic values that are well matched within the presented post-AGB stellar model. The observed isotopic anomalies suggest that KFC1h-524 could originate from a post-AGB star undergoing the VLTP phase.
3.3. Comparison to rapidly accreting white dwarf model
A rapidly accreting white dwarf (RAWD) is a white dwarf in a close binary system with another star in the main sequence, subgiant, red giant, or AGB phase. The white dwarf accretes H-rich envelope material from its companion star, which burns steadily on the surface to produce a subsurface shell of He ash. Once the He shell reaches a critical density, flash He-burning occurs and convection is triggered. Protons from the surface are ingested into the He shell, where they react with 12C to form unstable 13N, which decays to 13C within minutes. As convection continues, 13C is transported to the bottom of the He-shell where it undergoes the 13C(α,n)16O reaction, releasing neutrons. The neutron density in this region of the He-shell can reach values that trigger i-process nucleosynthesis (Nn ∼ 1015 cm−3; Côté et al. 2018). These conditions are very similar to the VLTP in a born-again AGB star (Herwig et al. 2011); however, rather than a single TP, RAWDs can undergo multiple TPs that can result in a higher i-processed ejected mass (Denissenkov et al. 2017).
In Fig. 3b, we compare the observed 96Zr anomalies in the grains to model predictions of RAWD ejecta (Denissenkov et al. 2019). The RAWD model during its evolution loses most of its mass, resulting in a pre-WD mass of 0.71 M⊙. At this stage, the model star starts accreting material from its companion star with solar composition. A cycle of repeated mass accretion and mass loss follows through He-shell flashes, which becomes the site of i-process nucleosynthesis. The peak neutron density for the RAWD model is ∼1013 cm−3.
Similarly to the model of Sakurai’s Object, we also explored timescales of subgrain formation by considering radiogenic contributions to Zr isotopes at four different times post nucleosynthesis for Denissenkov et al. (2017)’s RAWD-B models (Fig. 3b). Both the RAWD and Sakurai’s Object models predict greater than solar 96Zr/94Zr for all four cases. The predicted ratios are larger than the ratios observed in the subgrains, except for KFC1h-721, whose δ96Zr/94Zr is very similar to that of the model calculations. However, this grain contains excesses in p-nuclides (92, 94Mo) that excludes an AGB, post-AGB, and RAWD origin. It is possible to explain smaller anomalies in subgrains compared to the predicted anomalies if the grain is smaller than the diameter of the ablation laser in RIMS. In such a scenario, the received signal is diluted by surrounding material that is of solar composition. For the smaller decay times (i.e., after 0 and 0.02 years), the models predict negative δ-values in 90, 91, 92Zr/94Zr. This agrees with the observed ratios in the subgrains. In contrast, models with longer timescales of grain formation result in positive δ90, 91Zr/94Zr, which are not observed in the subgrains. Therefore, the models predict a time frame of subgrain condensation to be within 2 years after the nucleosynthesis occurs.
Both the RAWD and Sakurai’s Object models predict low 12C/13C, thus, grain KFC1h-524 (12C/13C = 13 ± 0.2) could originate in either of these stellar environments. While we know that post-AGB stars that experience a VLTP should be efficient dust producers, based on observational evidence from Sakurai’s Object (e.g., Evans et al. 2022), the amount of dust that is produced and the ability to seed the interstellar medium with this dust has not been determined yet. A significant portion of AGB stars (of all masses and metallicities) in binary systems go through the RAWD phase and pollute the interstellar medium through multiple TPs. Therefore, RAWDs would be a more effective source of elements produced by the i-process than post-AGB stars (Denissenkov et al. 2017; Côté et al. 2018).
Another possibility is that this grain originated from an AGB star with mild HBB because AGB stars lose orders of magnitude more mass than post-AGB stars. However, only ≦1% of AGB stars are within the narrow range of mass (3 to 4.5 M⊙) and metallicity (Z ≦ 0.014) that can explain the observed data (e.g., Li et al. 2023; Hayden et al. 2015). Thus, RAWDs are the most likely stellar progenitor for KFC1h-524.
The 96Zr excess of grain KFC1-5.01 (δ12Zr/94Zr = 9377 ± 1251‰; Fig. 2), reported by Nicolussi et al. (1998), is almost two times the calculated ratios in the RAWD models and the post-AGB models and, therefore, cannot be explained by either of the stellar models considered here. However, current uncertainties affecting neutron-capture rates relevant for i-process nucleosynthesis could affect the final isotopic pattern compared with presolar grain data (Denissenkov et al. 2018). Therefore, the extreme Zr anomalies in KFC1-5.01 should be tested in the future, considering the impact of nuclear uncertainties on different i-process stellar sites.
The isotopic anomalies observed in grain KFC1h-524 suggest that it is most likely condensed from material from a RAWD. While i-process nucleosynthesis has been identified in presolar graphite grains before (Jadhav et al. 2013b), this is the first evidence in presolar grains for i-process nucleosynthesis in RAWDs.
3.4. Comparison to core-collapse supernova models
Neither born-again AGB star or RAWD models have the ability to produce p-nuclides (as observed in KFC1h-721 and -614) and we need to consider massive stars for this purpose. Core-collapse supernovae (CCSNe) are the second-most prolific dust-producers in the Galaxy after AGB stars and they are a known minor source of HD graphite grains (Jadhav et al. 2013a). Massive stars with initial mass > 10 M⊙ can reach peak temperatures of up to several 109 K during supernova explosions, triggering nucleosynthesis processes, such as the γ-process, which is responsible for the production of neutron deficient (proton-rich) nuclei heavier than iron (e.g., Arnould & Goriely 2003; Rauscher et al. 2013; Pignatari et al. 2016; Roberti et al. 2023, 2024). Therefore, the excesses in p-process isotopes 92, 94Mo in KFC1h-614 and KFC1h-721 most likely indicates a supernova origin for these grains. The γ-process can also occur in thermonuclear supernovae that originate from the explosion of white dwarf binary systems (e.g., Travaglio et al. 2011). However, since CCSNe are effective producers of dust, while thermonuclear supernovae are not confirmed dust producers (e.g., Nozawa et al. 2011; Gomez et al. 2012; Nittler & Ciesla 2016), the observed 92Mo and 94Mo excesses point to a CCSN origin for the aforementioned grains. Therefore, we compare the observed isotopic ratios to isotopic signatures predicted from massive progenitor stars with initial masses of 15, 20, and 25 M⊙ (Ritter et al. 2018); hereafter, referred to as RIT15, RIT20, and RIT25, respectively. We find that the measured data agrees best with the RIT15 model. As shown in Fig. 4, the observed 96Zr/94Zr in subgrains of KFC1h-614 and KFC1h-721 are, within 2σ uncertainty, matched by the stellar ejecta from the He/C zone, where zones in a SN ejecta are defined by the two most abundant elements in that region (Meyer et al. 1995).
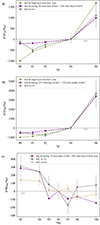 |
Fig. 4. Comparison of Zr data in grains to CCSNe models. (a) and (b) Zirconium isotopic ratios vs. atomic masses measured in anomalous subgrains in grains KFC1h-614 and KFC1h-721 and best-fit mixing lines obtained from the RIT15 model. (c) Molybdenum isotopic ratios vs. atomic masses of Mo isotopes measured in anomalous subgrains in grains KFC1h-614 and KFC1h-721. The best result from our two-layer mixing calculations is shown by the purple dashed line. Grey dashed line indicates the solar isotopic values. All errors bars show 1σ variation. |
In this region, 96Zr is mostly made during explosive He-burning via the n-process (Meyer et al. 2000), driven by the 22Ne(α,n)25Mg reaction (Pignatari et al. 2018). The other Zr isotopic ratios (91, 92Zr/96Zr) also fit well with the same stellar layers from the He/C zone. However, the subgrains contain δ90Zr/94Zr anomalies that are smaller than the model predictions by ∼500−1000‰. Mixing with Solar System material could explain the dilution of this ratio. An alternative explanation to the observed lower anomalies would be a mixing of the n-process-rich materials from the He/C zone with those of less anomalous material in the supernova ejecta (e.g., the former stellar envelope of the massive star CCSN progenitor or the external He/C zone that was not processed by the explosion). Astronomical observations and hydrodynamical modeling have shown evidence of some degree of mixing within CCSNe ejecta (e.g., Hughes et al. 2000; Hammer et al. 2010) and isotopic anomalies observed in various presolar grain phases have previously been explained by mixing calculations (Travaglio et al. 1999; Nittler et al. 2008; Lin et al. 2010; Stephan et al. 2018; Jadhav et al. 2013a). Recently, 84Sr enrichments in several HD graphites from the KFB1 density fraction of Murchison were explained by mixing γ-process products from the interior O/Si zones with C-rich material of the He/C zone (Pal et al. 2025). We modeled a similar mixing scenario for the anomalous Zr isotopes observed in the grains of this study. We found that for KFC1h-721, the observed Zr isotopic ratio can be reproduced by mixing between two different layers in the He/C zone (see Fig. 5). While such ad hoc mixing of CCSN layers to explain presolar grain data is currently a matter of debate, these mixing calculations could be an indirect measure of dynamical interactions between ejected CCSN layers (e.g., Pignatari et al. 2013; Schofield et al. 2022; Liu et al. 2024; Hoppe et al. 2024).
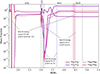 |
Fig. 5. Isotopic abundance profile of the RIT15. Stellar zones are demarcated with vertical dashed lines and labeled on the top of the graph. Thick purple dashed lines show the variation of 96Zr/94Zr and 90Zr/94Zr in the stellar model. Thick pink dashed lines show the variation of 92Mo/96Mo and 94Mo/96Mo in the stellar model. Locations of the stellar layers that mix to replicate Zr and Mo isotopic signatures from measuring subgrains within grains KFC1h-614 and KFC1h-721 are highlighted with pink and blue shaded vertical regions. |
In our calculations, we imposed the constraint that the grains must condense from a C-rich environment (C/O > 1), following evidence drawn from condensation sequence calculations (Bernatowicz et al. 2005) and microstructural studies of presolar graphite grains (Croat et al. 2003). As shown in Fig. 4, mixing of ∼27% of a layer from the base of the He/C zone with 73% from the middle of the same zone results in the Zr isotopic pattern observed in KFC1h-721. We obtained similar results for the 96Zr-excess in a subgrain of KFC1h-614 from a mixture of ∼6% of material from the base of the He/C zone with ∼94% from the base of the He/N zone (Fig. 4). The Mo isotopic ratios of the grains, however, could not be reproduced by mixing the same layers. Mo-92 and Mo-94 are believed to be produced in the hot inner regions of a supernova by the γ-process through the photodisintegration of heavier nuclides (Pignatari et al. 2016; Roberti et al. 2023). To obtain the p-nuclide enriched Mo isotopic composition observed in the grains under the C/O > 1 constraint, we need to mix 2−3% of material from the inside of the O/Si zone with that of materials near the boundary of the He/C and He/N zones (Fig. 4).
In this scenario, grains KFC1h-614 and KFC1h-721 are expected to contain subgrains that preserve the γ-process nucleosynthesis, as shown through their Mo isotopes. These subgrains are most likely not the same as those that contain excesses in 96Zr and preserve the n-process signatures from the He/C zone of CCSNe. Graphite grains have been demonstrated to carry subgrains with various phases that have condensed at different times (Croat et al. 2003). In this study, we show that both KFC1h-614 and KFC1h-721 likely contain subgrains that preserve more than one nucleosynthetic signatures which occur in massive stars and CCSN explosions.
4. Conclusions
We report four HD graphite grains from Murchison with subgrains containing excesses of 96Zr. We identify the stellar sources of these grains, by focusing on the isotopes of Zr, C, and N measured in them. Models of intermediate mass AGB stars (3−4 M⊙) and subsolar metallicities (Z = 0.0028 − 0.014) produce a neutron density sufficient to synthesize excess 96Zr (Karakas et al. 2018), that is observed in KFC1h-343 and KFC1h-524. However, the observed 96Zr and 13C excesses could also be the product of i-process nucleosynthesis in a post-AGB stars that suffered a VLTP (Herwig et al. 2011) or in other stellar sources potentially hosting the i-process, such as RAWDs (Denissenkov et al. 2019). Based on current knowledge of dust production in these sources and their relative populations, we argue that a RAWD is the most likely stellar source for KFC1h-524. Thus, this study introduces RAWDs as a new stellar source of presolar grains for the first time. Further, single layer or two-layer mixing in a 15 M⊙ CCSN model produce Zr isotopic compositions that match those observed in grains KFC1h-614 and KFC1h-721. Thus, C-rich CCSN ejecta can also produce the observed 96Zr excesses via the n-process (Pignatari et al. 2018).
Overall, this study highlights the significant value of multi-element isotopic measurements on individual grains. They enable us to not only set tight constraints on the type of progenitor star, but also determine the nucleosynthesis phase of the star’s evolution the grain material condensed in.
Acknowledgments
IP acknowledges NASA FINESST award 80NSSC22K1330. MJ acknowledges NSF 20-543 award no. 2033380. MRS and DZS acknowledge funding from the LLNL Glen T. Seaborg Institute and LLNL-LDRD Program under Project 20-ERD-030. MRS and DZS work was performed under the auspices of the U.S. Department of Energy by Lawrence Livermore National Laboratory under Contract DE-AC52-07NA27344. LLNL-JRNL-2008120. SA acknowledges support by grant 80NSSC22K0360 from the NASA Emerging Worlds program. WiscSIMS is partly supported by NSF (EAR1658823). We thank Tom Yuzvinsky and Yang Mu for electron microscopy and ion milling work at the W.M. Keck Center for Nanoscale Optofluidics at UCSC and the Shared Instrumentation Facility at LSU. MP, LR, and ML thank the support from the NKFIH via project-K 138031 and NKKP Advanced grant 153697, and MP and LR acknowledges the support from the ChETEC-INFRA – Transnational Access (Project 22102724-ST) and access to ‘viper’, the University of Hull HPC Facility. MP and LR acknowledge the support to NuGrid from the National Science Foundation (NSF, USA) under grant No. PHY-1430152 (JINA Center for the Evolution of the Elements), and the IReNA network by NSF AccelNet (Grant No. OISE-1927130). MP, ML, BS and LR thank the Lendület Program LP2023-10/2023 of the Hungarian Academy of Sciences. ML was also supported by the NKFIH excellence grant TKP2021-NKTA-64. MP, ML, and LR acknowledge support from the ChETEC-INFRA project funded by the European Union’s Horizon 2020 Research and Innovation programme (Grant Agreement No. 101008324), and the support from the ChETEC-INFRA – Transnational Access Projects 22102724-ST and 23103142-ST and the PRIN URKA Grant Number 2022RJLWHN. MP thanks the support from the ERC Synergy Grant Programme (Geoastronomy, grant agreement number 101166936, Germany). This research has used the Astrohub online virtual research environment (https://astrohub.uvic.ca), developed and operated by the Computational Stellar Astrophysics group (https://www.uvic.ca/research/centres/arc/research/stellar-astrophysics/index.php) at the University of Victoria and hosted on the Computed Canada Arbutus Cloud at the University of Victoria.
References
- Amari, S., Zinner, E., & Lewis, R. S. 1995, ApJ, 447, L147 [Google Scholar]
- Amari, S., Nittler, L. R., Zinner, E., Lodders, K., & Lewis, R. S. 2001, ApJ, 559, 463 [NASA ADS] [CrossRef] [Google Scholar]
- Amari, S., Zinner, E., & Gallino, R. 2014, Geochim. Cosmochim. Acta, 133, 479 [Google Scholar]
- Amari, S., Kita, N. R., Gyngrad, F., & Lugaro, M. 2017, Lunar Planet. Sci. Conf., XLVIII, 1947 [Google Scholar]
- Arlandini, C., Käppeler, F., Wisshak, K., et al. 1999, ApJ, 525, 886 [Google Scholar]
- Arnould, M., & Goriely, S. 2003, Phys. Rep., 384, 1 [Google Scholar]
- Asplund, M., Gustafsson, B., Lambert, D. L., & Rao, N. K. 1997, A&A, 321, L17 [Google Scholar]
- Barzyk, J. G., Savina, M. R., Davis, A. M., et al. 2007, Meteor. Planet. Sci., 42, 1103 [Google Scholar]
- Battino, U., Pignatari, M., Ritter, C., et al. 2016, ApJ, 827, 30 [NASA ADS] [CrossRef] [Google Scholar]
- Bernatowicz, T. J., Amari, S., Zinner, E. K., & Lewis, R. S. 1991, ApJ, 373, L73 [Google Scholar]
- Bernatowicz, T. J., Cowsik, R., Gibbons, P. C., et al. 1996, ApJ, 472, 760 [Google Scholar]
- Bernatowicz, T. J., Akande, O. W., Croat, T. K., & Cowsik, R. 2005, ApJ, 631, 988 [Google Scholar]
- Bertolami, M. M., Althaus, L. G., Serenelli, A., & Panei, J. A. 2006, A&A, 449, 313 [NASA ADS] [CrossRef] [EDP Sciences] [Google Scholar]
- Bisterzo, S., Travaglio, C., Gallino, R., Wiescher, M., & Käppeler, F. 2014, ApJ, 787, 10 [NASA ADS] [CrossRef] [Google Scholar]
- Bisterzo, S., Gallino, R., Käppeler, F., et al. 2015, MNRAS, 449, 506 [Google Scholar]
- Côté, B., Denissenkov, P., Herwig, F., et al. 2018, ApJ, 854, 105 [Google Scholar]
- Cowan, J. J., & Rose, W. K. 1977, ApJ, 212, 149 [Google Scholar]
- Cristallo, S., Piersanti, L., Straniero, O., et al. 2011, ApJS, 197, 17 [NASA ADS] [CrossRef] [Google Scholar]
- Cristallo, S., Straniero, O., Piersanti, L., & Gobrecht, D. 2015, ApJS, 219, 40 [Google Scholar]
- Cristallo, S., La Cognata, M., Massimi, C., et al. 2018, ApJ, 859, 105 [Google Scholar]
- Croat, T. K., Bernatowicz, T., Amari, S., Messenger, S., & Stadermann, F. J. 2003, Geochim. Cosmochim. Acta, 67, 4705 [Google Scholar]
- Croat, T. K., Stadermann, F. J., & Bernatowicz, T. J. 2005, ApJ, 631, 976 [Google Scholar]
- Denissenkov, P. A., Herwig, F., Battino, U., et al. 2017, ApJ, 834, L10 [Google Scholar]
- Denissenkov, P., Perdikakis, G., Herwig, F., et al. 2018, J. Phys. G: Nucl. Part. Phys., 45, 055203 [Google Scholar]
- Denissenkov, P. A., Herwig, F., Woodward, P., et al. 2019, MNRAS, 488, 4258 [Google Scholar]
- Duerbeck, H. W., & Benetti, S. 1996, ApJ, 468, L111 [NASA ADS] [CrossRef] [Google Scholar]
- Evans, A., Banerjee, D. P., Geballe, T. R., et al. 2022, MNRAS, 511, 713 [NASA ADS] [CrossRef] [Google Scholar]
- Fishlock, C. K., Karakas, A. I., Lugaro, M., & Yong, D. 2014, ApJ, 797, 44 [Google Scholar]
- Fujiya, W., Hoppe, P., Zinner, E., Pignatari, M., & Herwig, F. 2013, ApJ, 776, L29 [Google Scholar]
- Gallino, R., Arlandini, C., Busso, M., et al. 1998, ApJ, 497, 388 [Google Scholar]
- Gomez, H. L., Clark, C. J. R., Nozawa, T., et al. 2012, MNRAS, 420, 3557 [NASA ADS] [CrossRef] [Google Scholar]
- Goriely, S., & Mowlavi, N. 2000, A&A, 362, 599 [NASA ADS] [Google Scholar]
- Haenecour, P., Floss, C., José, J., et al. 2016, ApJ, 825, 88 [NASA ADS] [CrossRef] [Google Scholar]
- Hammer, N., Janka, H.-T., & Müller, E. 2010, ApJ, 714, 1371 [NASA ADS] [CrossRef] [Google Scholar]
- Hayden, M. R., Bovy, J., Holtzman, J. A., et al. 2015, ApJ, 808, 132 [Google Scholar]
- Herwig, F. 2005, ARA&A, 43, 435 [NASA ADS] [CrossRef] [Google Scholar]
- Herwig, F., Bloecker, T., Langer, N., & Driebe, T. 1999, A&A, 349, L5 [Google Scholar]
- Herwig, F., Pignatari, M., Woodward, P. R., et al. 2011, ApJ, 727, 89 [Google Scholar]
- Hoppe, P., Leitner, J., Pignatari, M., & Amari, S. 2024, MNRAS, 532, 211 [Google Scholar]
- Hughes, J. P., Rakowski, C. E., Burrows, D. N., & Slane, P. O. 2000, ApJ, 528, L109 [Google Scholar]
- Iben, I. 1984, ApJ, 277, 333 [Google Scholar]
- Ishida, A., Kitajima, K., Williford, K. H., et al. 2018, Geostand. Geoanal. Res., 42, 189 [Google Scholar]
- Jadhav, M., Savina, M. R., Jokela, S., et al. 2012, Meteor. Planet. Sci. Suppl., 75, 5183 [Google Scholar]
- Jadhav, M., Zinner, E., Amari, S., et al. 2013a, Geochim. Cosmochim. Acta, 113, 193 [Google Scholar]
- Jadhav, M., Pignatari, M., Herwig, F., et al. 2013b, ApJ, 777, L27 [NASA ADS] [CrossRef] [Google Scholar]
- Käppeler, F., Gallino, R., Bisterzo, S., & Aoki, W. 2011, Rev. Mod. Phys., 83, 157 [Google Scholar]
- Karakas, A. I., & Lattanzio, J. C. 2014, PASA, 31, e030 [NASA ADS] [CrossRef] [Google Scholar]
- Karakas, A. I., & Lugaro, M. 2016, ApJ, 825, 26 [NASA ADS] [CrossRef] [Google Scholar]
- Karakas, A. I., Lugaro, M., Carlos, M., et al. 2018, MNRAS, 477, 421 [NASA ADS] [CrossRef] [Google Scholar]
- Kipper, T., & Klochkova, V. G. 1997, A&A, 324, L65 [Google Scholar]
- Li, K.-A., Qi, C., Lugaro, M., et al. 2021, ApJ, 919, L19 [CrossRef] [Google Scholar]
- Li, J., Liu, C., Zhang, Z.-Y., et al. 2023, Nature, 613, 460 [NASA ADS] [CrossRef] [Google Scholar]
- Lin, Y., Gyngard, F., & Zinner, E. 2010, ApJ, 709, 1157 [Google Scholar]
- Liu, N., Savina, M. R., Davis, A. M., et al. 2014, ApJ, 786, 66 [NASA ADS] [CrossRef] [Google Scholar]
- Liu, N., Cristallo, S., & Vescovi, D. 2022, Universe, 8, 362 [CrossRef] [Google Scholar]
- Liu, N., Lugaro, M., Leitner, J., Meyer, B. S., & Schönbächler, M. 2024, Space Sci. Rev., 220, 88 [Google Scholar]
- Lugaro, M., Davis, A. M., Gallino, R., et al. 2003, ApJ, 593, 486 [NASA ADS] [CrossRef] [Google Scholar]
- Lugaro, M., Tagliente, G., Karakas, A. I., et al. 2014, ApJ, 780, 95 [Google Scholar]
- Lugaro, M., Karakas, A. I., Pető, M., & Plachy, E. 2018, Geochim. Cosmochim. Acta, 221, 6 [CrossRef] [Google Scholar]
- Lugaro, M., Pignatari, M., Reifarth, R., & Wiescher, M. 2023, Annu. Rev. Nucl. Part. Sci., 73, 315 [NASA ADS] [CrossRef] [Google Scholar]
- Meija, J., Coplen, T. B., Berglund, M., et al. 2016, Pure Appl. Chem., 88, 293 [Google Scholar]
- Meyer, B. S., Weaver, T. A., & Woosley, S. E. 1995, Meteoritics, 30, 325 [Google Scholar]
- Meyer, B. S., Clayton, D. D., & The, L.-S. 2000, ApJ, 540, L49 [NASA ADS] [CrossRef] [Google Scholar]
- Nicolussi, G. K., Davis, A. M., Pellin, M. J., et al. 1997, Science, 277, 1281 [Google Scholar]
- Nicolussi, G. K., Pellin, M. J., Lewis, R. S., et al. 1998, ApJ, 504, 492 [Google Scholar]
- Nittler, L. R., & Ciesla, F. 2016, ARA&A, 54, 53 [NASA ADS] [CrossRef] [Google Scholar]
- Nittler, L. R., Amari, S., Zinner, E., Woosley, S., & Lewis, R. S. 1996, ApJ, 462, L31 [Google Scholar]
- Nittler, L. R., Alexander, C. M., Gallino, R., et al. 2008, ApJ, 682, 1450 [NASA ADS] [CrossRef] [Google Scholar]
- Nozawa, T., Maeda, K., Kozasa, T., et al. 2011, ApJ, 736, 45 [NASA ADS] [CrossRef] [Google Scholar]
- Pal, I., Jadhav, M., Savina, M. R., et al. 2022, Meteor. Planet. Sci., 57 [Google Scholar]
- Pal, I., Jadhav, M., Raiwa, M. A., et al. 2023, LPI Contrib., 2990, 6147 [Google Scholar]
- Pal, I., Jadhav, M., Shulaker, D. Z., et al. 2025, ApJ, 994, L21 [Google Scholar]
- Palmerini, S., Cristallo, S., Busso, M., et al. 2011, ApJ, 741, 26 [NASA ADS] [CrossRef] [Google Scholar]
- Pignatari, M., Wiescher, M., Timmes, F. X., et al. 2013, ApJ, 767, L22 [Google Scholar]
- Pignatari, M., Göbel, K., Reifarth, R., & Travaglio, C. 2016, Int. J. Mod. Phys. E, 25, 1630003 [NASA ADS] [CrossRef] [Google Scholar]
- Pignatari, M., Hoppe, P., Trappitsch, R., et al. 2018, Geochim. Cosmochim. Acta, 221, 37 [NASA ADS] [CrossRef] [Google Scholar]
- Raiwa, M., Savina, M., Shulaker, D. Z., Roberts, A., & Isselhardt, B. 2024, J. Anal. At. Spectrom., 39, 1803 [Google Scholar]
- Rauscher, T., Dauphas, N., Dillmann, I., et al. 2013, Rep. Progr. Phys., 76, 066201 [CrossRef] [Google Scholar]
- Ritter, C., Herwig, F., Jones, S., et al. 2018, MNRAS, 480, 538 [NASA ADS] [CrossRef] [Google Scholar]
- Roberti, L., Pignatari, M., Psaltis, A., et al. 2023, A&A, 677, A22 [NASA ADS] [CrossRef] [EDP Sciences] [Google Scholar]
- Roberti, L., Limongi, M., & Chieffi, A. 2024, ApJS, 270, 28 [NASA ADS] [CrossRef] [Google Scholar]
- Savina, M. R., Pellin, M. J., Tripa, C. E., et al. 2003, Geochim. Cosmochim. Acta, 67, 3215 [Google Scholar]
- Savina, M. R., Davis, A. M., Tripa, C. E., et al. 2004, Lunar Planet. Sci. Conf., 1877 [Google Scholar]
- Savina, M. R., Trappitsch, R., Kucher, A., & Isselhardt, B. H. 2018, Anal. Chem., 90, 10551 [Google Scholar]
- Savina, M. R., Isselhardt, B. H., Shulaker, D. Z., et al. 2023, Sci. Rep., 13, 5193 [Google Scholar]
- Schofield, J., Pignatari, M., Stancliffe, R. J., & Hoppe, P. 2022, MNRAS, 517, 1803 [Google Scholar]
- Stephan, T., Trappitsch, R., Davis, A. M., et al. 2016, Int. J. Mass Spectrom., 407, 1 [Google Scholar]
- Stephan, T., Trappitsch, R., Davis, A. M., et al. 2018, Geochim. Cosmochim. Acta, 221, 109 [Google Scholar]
- Straniero, O., Gallino, R., Busso, M., et al. 1995, ApJ, 440, L85 [NASA ADS] [CrossRef] [Google Scholar]
- Tartèse, R., Chaussidon, M., Gurenko, A., Delarue, F., & Robert, F. 2016, Geochem. Perspect. Lett., 3, 55 [Google Scholar]
- Travaglio, C., Gallino, R., Amari, S., et al. 1999, ApJ, 510, 325 [Google Scholar]
- Travaglio, C., Röpke, F., Gallino, R., & Hillebrandt, W. 2011, ApJ, 739, 93 [NASA ADS] [CrossRef] [Google Scholar]
- Trippella, O., Busso, M., Palmerini, S., Maiorca, E., & Nucci, M. C. 2016, ApJ, 818, 125 [Google Scholar]
- Williford, K. H., Ushikubo, T., Lepot, K., et al. 2016, Geobiology, 14, 105 [Google Scholar]
- Zinner, E. 2014, Treatise Geochem., 181 [Google Scholar]
Appendix A: Methods
A.1. Analysis of light element isotopes
Presolar graphite grains from the Murchison density fraction 2.15-2.20 g/cm3 were deposited onto gold foils. Their locations were documented with scanning electron microscope (SEM) JEOL JSM-840A at the Washington University, St. Louis. Using the NanoSIMS facility at Washington University, 12C−, 13C−, 12C14N−, and 12C15N− were simultaneously collected to measure the C and N isotopic ratios in the grains (Amari et al. 2017). DAG carbon paint and synthetic Si3N4 were used for C and N standards, respectively (Ishida et al. 2018). Oxygen isotopes were measured using University of Wisconsin-Madison’s CAMECA IMS-1280. A focused Cs+ ion beam of 5 pA was used to obtain secondary ions of 16O−, 17O−, 18O−, which were detected simultaneously using electron multipliers. UWMA1 standard (Williford et al. 2016; Ishida et al. 2018), which is a terrestrial organic matter with about 2 wt.% oxygen (Tartèse et al. 2016), was used to correct the measured oxygen isotopic ratios. Details of light element isotopic measurements on KFC1 grains can be found in Amari et al. (2017).
A.2. Analysis of heavy element isotopes
Heavy element isotopic analysis was performed with Resonance Ionization Mass Spectrometry (RIMS) at the Laser Ionization of Neutrals (LION) facility at the Lawrence Livermore National Laboratory. To prevent grain loss during laser sputtering at LION, the grains were C-welded to their gold mounts. The grains were then marked with fiducials by gallium ion milling in order to facilitate navigation during RIMS analyses easier. This was followed by redocumentation of the grains with SEM. The welding, milling, and redocumentation work for the KFC1h grains was performed using Focused Ion Beam (FIB)-SEM at the Shared Instrumentation Facility of the Louisiana State University. Nineteen KFC1h grains were found to have enough material left for RIMS analysis, which were then simultaneously measured for the 90, 91, 92, 94, 96Zr, 92, 94, 95, 96, 97, 98, 100Mo and 96, 98, 99, 100, 101, 102, 104Ru isotopes. Two-color, two-photon excitation schemes were used to ionize the elements, therefore, employing two tunable lasers for each element (six lasers in total). The first laser excites an electron of a selected element into an excited state, while the second laser excites the electron further to an autoionizing state or Rydberg level close to the ionization potential. See Raiwa et al. (2024) for the Zr ionization scheme, Nicolussi et al. (1998) and Barzyk et al. (2007) for the Mo ionization scheme, and Savina et al. (2004) for the Ru ionization scheme. These resonantly ionized photoions were then accelerated into a time-of-flight mass analyzer and detected by a discrete dynode detector. To avoid isobaric interferences, Zr, Mo, and Ru ionization lasers were offset in time. After the extraction laser was fired, the pair of Zr lasers were fired 20 ns later, then the Mo lasers were triggered an additional 150 ns later, and the Ru lasers were fired last after an additional 200 ns. This way, each element was ionized at a different time, resulting in different arrival times of isobars at the detector, such that each isobar manifested itself as an individual peak in the mass spectrum, thereby avoiding interferences from isobars in the analyses.
Integrals of the isotope peaks were corrected for background noise by subtracting counts from the adjacent regions before and after the mass peaks. Noise was almost always symmetric around the mass peaks, except in one case for which the higher side was used for subtraction.
All data are normalized to solar (i.e., terrestrial) standards (Meija et al. 2016) and are expressed as δ-values, in part-per-thousand (permille) deviation from standard ratios: (δ96Zr = 1000[(96Zr/94Zr)sample/(96Zr/94Zr)solar − 1]) where Rsample is the A:B isotope ratio measured in the grain and Rstandard is the same isotope ratio measured in the standard.
Sixteen out of the 19 grains had significant counts of 96Zr above the background noise for which we calculated delta values of 96Zr. Overall, significant excesses in 96Zr were observed in 4 grains. On further examination by binning data into 30,000 to 10,000 laser shots packages, we identified these anomalies to be concentrated in brief bursts. If the 94Zr counts were so high that some of the 94Zr hit the detector within the 1.5 ns time needed between each ion count, this lead to undercounting of 94Zr and give rise to a false positive δ96Zr94. This deadtime issue was checked using the 91Zr/94Zr ratio, which is very close to the solar value for both the s- and r-processes. If deadtime on 94Zr was significant, the 91Zr/94Zr would be positive. Since our ratios are negative, we consider deadtime effects to be insignificant during the bursts.
The signals from various isotopes of the measured elements typically appeared in separate bursts, although in some instances they appear together. In all measured grains, Mo was more abundant than Zr and appeared more often during measurement. This led us to infer that Mo and Zr may not necessarily come from the same subgrains. In addition, subgrains in graphite grains are a few tens of nanometers in diameter, whereas the laser beam size is 1–2 μm. Therefore, the signal at any given point is likely a mixture of one or multiple subgrains and the matrix material. Fig. A.1 shows an example of the time evolution of the elemental counts of Mo and Zr in KFC1h-343. Though Zr appears as multiple bursts throughout, the excess in 96Zr is only observed around 8 min into measurement. Although we see a burst in both Zr and Mo at this time, for the reasons explained above we cannot confirm whether the signals correspond to a singular subgrain or multiple subgrains.
A.3. Mixing calculations
Isotopic abundance profile of post-core collapse supernova explosion from stellar models with initial masses of 15, 20 and 25 M⊙ from the NuGrid stellar library I (Ritter et al. 2018) were used. The ejecta in these model are divided into thousands of layers and classified into 6 to 7 zones based on their one or two most abundant element(s) (Meyer et al. 1995). We mix any two layers of the stellar ejecta to replicate the isotopic ratios of the grains.
For each layer, isotopic abundances were calculated by adding all the radiogenic contributions. We constrain the best mixing solution by matching the measured 96Zr of the subgrains. Layers with 96Zr/94Zr greater (H) than the target subgrain mix with those of lower ratios (L), to generate the relative abundance of 96Zr in the target subgrain by solving the following equation:
 (A.1)
(A.1)
where k is the mixing factor which ranges from 0 to 1, G stands for the 96Zr/94Zr isotopic ratios of the subgrains, and 96Zr and 94Zr are the abundances in the stellar ejecta layers. Ratios for other Zr isotopes were calculated using the solution for k in the above equation, along with the C/O ratios. The combination with the least-squared difference with the observed subgrain data, which also has a C/O ratio > 1, is then normalized to solar values and calculated for δ-values.
 (A.2)
(A.2)
Using the mixing calculation we find the best-fit layer combinations that have the least mean square difference with the grain composition. Fig. 4 shows the results from these combinations. For KFC1h-614, the best match with a single layer is from RIT15 model’s layer no. 1067 at mass point ∼3.0 M⊙, while for KFC1h-721 it is layer no. 1206 at mass point ∼3.2 M⊙. Best-fit results of Zr isotopes for two-layer mixing combinations are: 6% of layer 1161 at mass point ∼3.1 M⊙ (He/C) with 1466 at mass point ∼4.5 M⊙ (He/N) for KFC1h-614; and 27% of layer 1115 at mass point ∼3.1 M⊙ (He/C) with layer 1388 at mass point ∼3.7 M⊙ (He/C) for KFC1h-721. For Mo isotopes, both grain data could be explained by a mixing of 3% from layer 186 at mass point ∼1.3 M⊙ (O/Si) with layer 1459 at mass point 4.4 M⊙ (He/N). Note that these combinations are only for best-case of mixing. Adjacent layers to the above-mentioned layer numbers are also able to mix to produce isotopic ratios like the grains. For example, mixing between O/Si layers with layers from the very top of the He/C zone can also explain the observed Mo isotopic signatures.
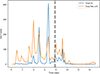 |
Fig. A.1. Time variation in Zr and Mo counts in grain KFC1h-343. The total counts from all isotopes of Mo and Zr (shown as orange and blue, respectively) are plotted against the time of measurement. For clarity, the Mo counts are scaled down by ten. The dashed, vertical grey line represents the time corresponding to the region of the grain that showed excess in 96Zr. |
All Tables
Light and heavy isotopic data of subgrains, with grain average (in brackets), for four KFC1 graphites from Murchison with 96Zr excesses.
All Figures
|
Fig. 1. Comparison of grain data to AGB stellar models. Three-isotope Zr plots of KFC1h presolar HD graphite grains. The four grains with positive δ96Zr94 values are indicated as black full circles, all the others as grey full circles. Two KFC1h grains with positive δ96Zr94 that were previously analyzed by Nicolussi et al. (1998) are shown as open squares. Isotopic ratios in the envelopes of various low-mass AGB stars at solar (Z = 0.014; Z is the mass fraction of elements heavier than He) and subsolar metallicities (Karakas et al. 2018) are shown as colored lines. Markers along these prediction lines indicate isotopic ratios when the stellar envelope is C-rich (C > O), which is the condition for the formation of graphite grains. The horizontal and vertical grey dashed lines represent solar ratios. The uncertainties are 1σ. |
| In the text | |
|
Fig. 2. Comparison of measured δ96Zr94 excesses to AGB models. The four subgrains with anomalous δ96Zr94 are shown as open circles. Zirconium isotopic ratios in the envelopes of AGB stars 3−4 M⊙ and low metallicity (Z = 0.0028 to 0.014) are plotted as colored lines, with markers indicating ratios in C-rich conditions in the envelope. Solar values of zero, by definition, are indicated with grey dashed lines. The uncertainties are 1σ. |
| In the text | |
|
Fig. 3. Comparison of subgrain Zr data to born-again AGB star and RAWD models. Zirconium isotopic ratios vs. atomic masses of Zr isotopes for subgrains measured in grains with 96Zr-excesses are shown with colored lines in panels a and b, respectively. Zirconium isotopic ratios from born-again AGB Sakurai’s Object (Herwig et al. 2011) and RAWD-B (Denissenkov et al. 2017) are plotted as grey dotted lines in the left and right column respectively. Results from four different decay times are shown with different markers as indicated in the legend. Grey dashed line represent the solar values. All errors show 1σ variation. |
| In the text | |
|
Fig. 4. Comparison of Zr data in grains to CCSNe models. (a) and (b) Zirconium isotopic ratios vs. atomic masses measured in anomalous subgrains in grains KFC1h-614 and KFC1h-721 and best-fit mixing lines obtained from the RIT15 model. (c) Molybdenum isotopic ratios vs. atomic masses of Mo isotopes measured in anomalous subgrains in grains KFC1h-614 and KFC1h-721. The best result from our two-layer mixing calculations is shown by the purple dashed line. Grey dashed line indicates the solar isotopic values. All errors bars show 1σ variation. |
| In the text | |
|
Fig. 5. Isotopic abundance profile of the RIT15. Stellar zones are demarcated with vertical dashed lines and labeled on the top of the graph. Thick purple dashed lines show the variation of 96Zr/94Zr and 90Zr/94Zr in the stellar model. Thick pink dashed lines show the variation of 92Mo/96Mo and 94Mo/96Mo in the stellar model. Locations of the stellar layers that mix to replicate Zr and Mo isotopic signatures from measuring subgrains within grains KFC1h-614 and KFC1h-721 are highlighted with pink and blue shaded vertical regions. |
| In the text | |
|
Fig. A.1. Time variation in Zr and Mo counts in grain KFC1h-343. The total counts from all isotopes of Mo and Zr (shown as orange and blue, respectively) are plotted against the time of measurement. For clarity, the Mo counts are scaled down by ten. The dashed, vertical grey line represents the time corresponding to the region of the grain that showed excess in 96Zr. |
| In the text | |
Current usage metrics show cumulative count of Article Views (full-text article views including HTML views, PDF and ePub downloads, according to the available data) and Abstracts Views on Vision4Press platform.
Data correspond to usage on the plateform after 2015. The current usage metrics is available 48-96 hours after online publication and is updated daily on week days.
Initial download of the metrics may take a while.