Fig. 5.
Download original image
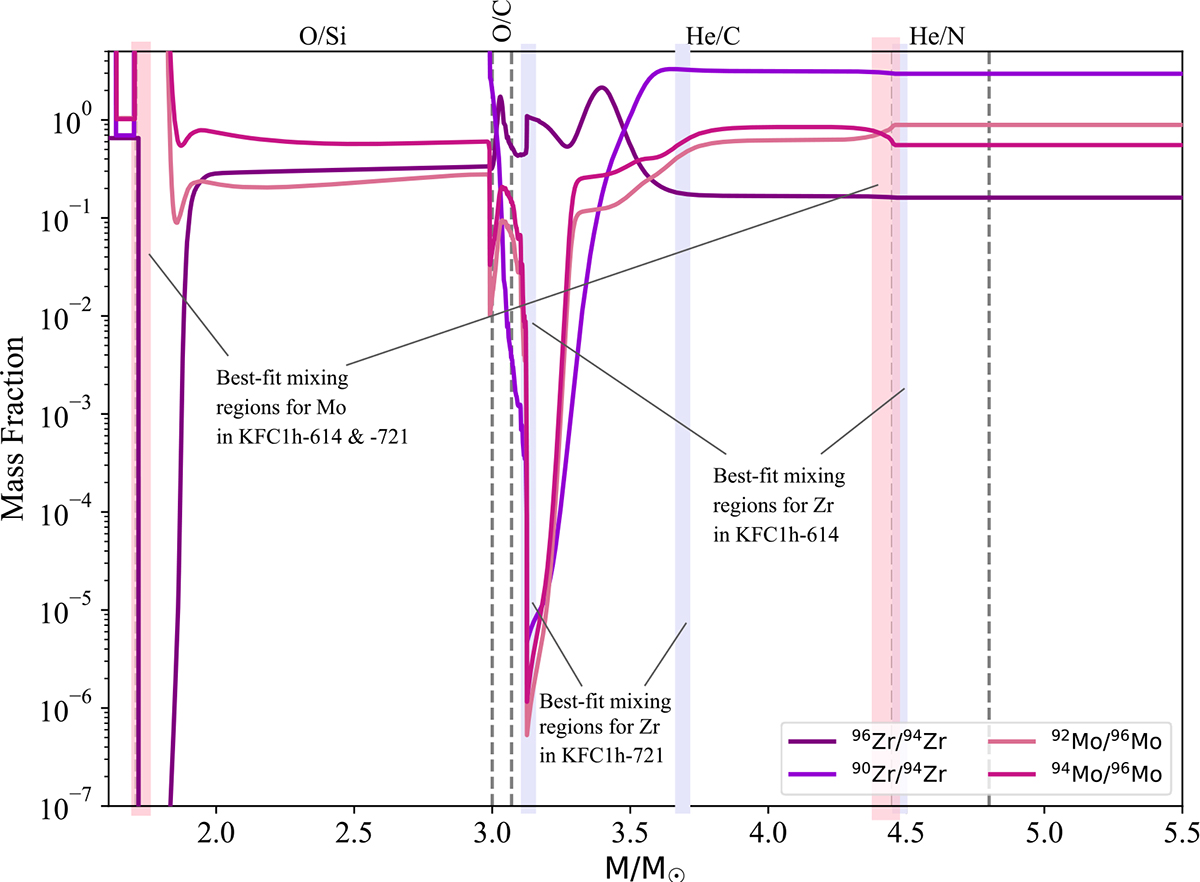
Isotopic abundance profile of the RIT15. Stellar zones are demarcated with vertical dashed lines and labeled on the top of the graph. Thick purple dashed lines show the variation of 96Zr/94Zr and 90Zr/94Zr in the stellar model. Thick pink dashed lines show the variation of 92Mo/96Mo and 94Mo/96Mo in the stellar model. Locations of the stellar layers that mix to replicate Zr and Mo isotopic signatures from measuring subgrains within grains KFC1h-614 and KFC1h-721 are highlighted with pink and blue shaded vertical regions.
Current usage metrics show cumulative count of Article Views (full-text article views including HTML views, PDF and ePub downloads, according to the available data) and Abstracts Views on Vision4Press platform.
Data correspond to usage on the plateform after 2015. The current usage metrics is available 48-96 hours after online publication and is updated daily on week days.
Initial download of the metrics may take a while.